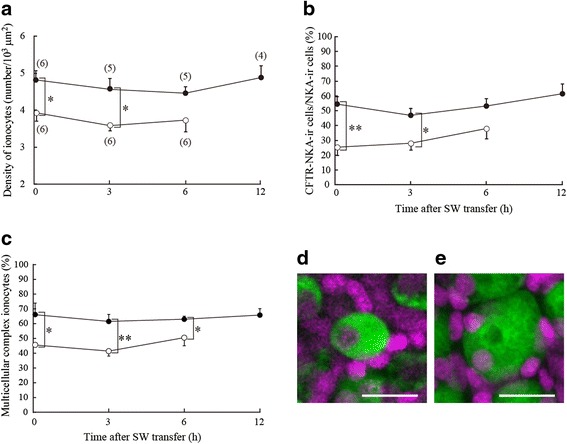
Fig. 5.

a–c Changes in the density of ionocytes (a), ratio of CFTR-immunoreactive ionocytes to NKA-immunoreactive ionocytes (b), and ratio of multicellular complex ionocytes to total ionocytes (c) after direct SW transfer of SW-experienced medaka (solid circles) and control FW medaka (open circles). Values are means ± SEM. Numerals in parentheses indicate the number of samples examined. There are no significant differences in those parameters within the same group (ANOVA, Tukey-Kramer multiple comparison test, P < 0.05). Asterisks indicate significant differences between the two groups at the same time points (two-sided Student’s t test, *P < 0.05 and **P < 0.01). d, e Micrographs of representative single (d) and multicellular complex (e) ionocytes in the gills. Whole mount samples of gill filaments were immunostained with anti-NKA (green) and counterstained with DAPI (magenta). Scale bar, 10 μm
