
Fig. 2.
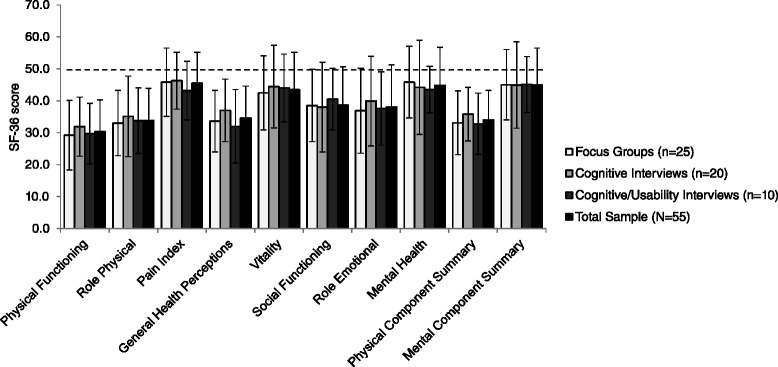
SF-36 results (mean ± standard deviation). Dashed line shows the general population norm score (50) for females and males in the US
Official websites use .gov
A
.gov website belongs to an official
government organization in the United States.
Secure .gov websites use HTTPS
A lock (
) or https:// means you've safely
connected to the .gov website. Share sensitive
information only on official, secure websites.
SF-36 results (mean ± standard deviation). Dashed line shows the general population norm score (50) for females and males in the US