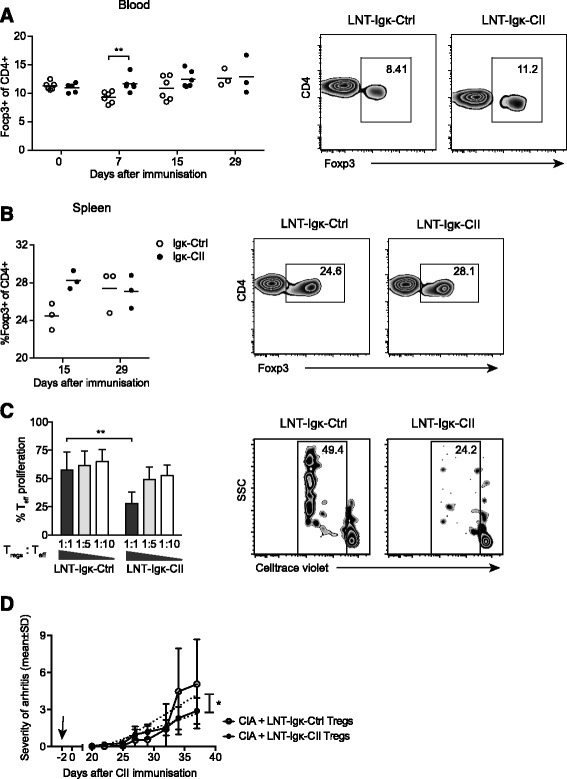
Fig. 5.

Frequency and suppressive capacity of Tregs. Treg frequency in a blood and b the spleen from LNT-Igk-Ctrl and LNT-Igk-CII mice at indicated time points during CIA. Indicated P values are calculated using Student’s t test. c Proliferation of Teffs (CD4+CD25–) from naïve DBA1 mice, stimulated for 6 days with APCs and αCD3 in the presence of Tregs (CD4+CD25+) from LNT-Igk-CII mice (n = 3) and LNT-Igk-Ctrl mice (n = 3) in Tregs: Teff ratio 1:1 (flow cytometry plot), 1:5 and 1:10. Two-way ANOVA was used to calculate P values. d Clinical severity of arthritis in mice that received Tregs from LNT-Igk-Ctrl mice (n = 5) or LNT-Igk-CII mice (n = 6) 2 days before CIA induction. The indicated P value is calculated using a comparison between slopes after linear regression and data are shown as mean ± SD. *P < 0.05; **P < 0.01; ***P < 0.001. CIA collagen-induced arthritis, CII collagen type II, Teff effector T cell, Treg T regulatory cell
