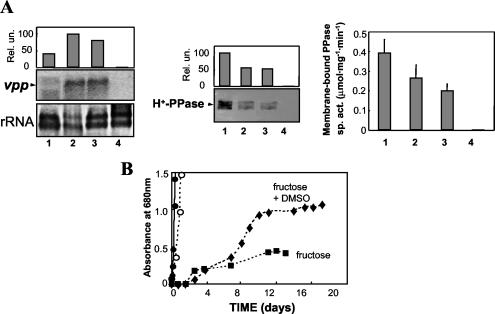
FIG. 4.
Comparative analysis of H+-PPase in R. rubrum cultures grown under different trophic conditions. (A) Samples were taken for each culture at the mid-exponential growth phase. Lane 1, anaerobic phototrophic; lane 2, fermentative; lane 3, anaerobic respiratory; lane 4, aerobic heterotrophic. Northern blot analysis normalized with rRNA quantification (left), Western blot analysis of membrane preparations (middle), and membrane-bound H+-PPase specific activity (sp. act.) (right) are shown; values are means ± SEM. (B) Growth curves under the different conditions tested. ○, phototrophic; •, aerobic heterotrophic; ▪, fermentative; ▴, anaerobic respiratory. Generation times for each culture were as follows: for phototrophic cultures, 9.8 h; for aerobic heterotrophic cultures, 1.9 h; for fermentative cultures, 186.6 h; for anaerobic respiratory cultures, 90.0 h.

