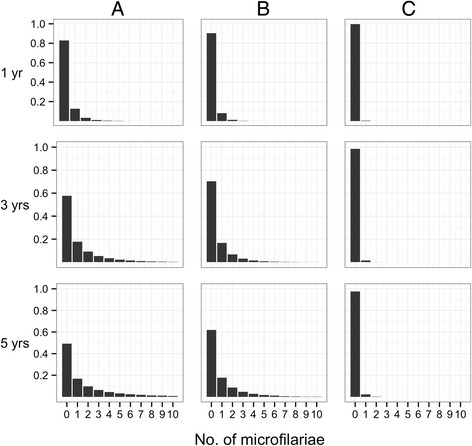
Fig. 3.

Frequency distribution of microfilarial load among skin snips taken from an individual infected with a single, fertile adult female worm. The vertical, y-axis, represents the proportion of snips with the number of microfilariae represented on the horizontal, x-axis. Rows correspond to times after the last treatment with ivermectin (upper row = 1 year; middle row = 3 years; bottom row = 5 years). Panels (a) to (c) and parameter values are as defined in Fig. 1
