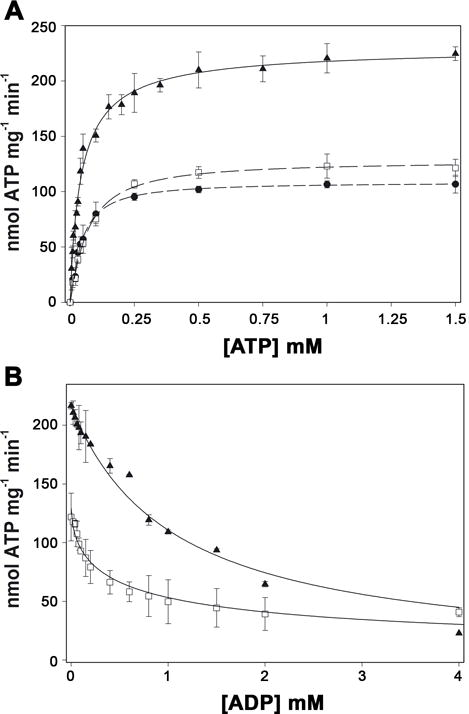
Figure 5. Effect of fatty acids on nucleotide binding.

A, ATP hydrolysis by TrwD (2 μM) was measured in the presence of 21 μM of linoleic acid (black circles) and 30 μM 2-HDA (white squares), and in the absence of fatty acids (black triangles). Data were fitted to a Hill equation. The K0.5ATP was 66 μM in the presence of 2-HDA and 44 μM in the presence of linoleic acid and in the absence of added fatty acids. B, ATP hydrolysis by TrwD (2 μM) was measured at increasing concentrations of ADP in the presence of 30 μM 2-HDA (white squares) and in its absence (black triangles). Data were fitted as previously described (Ripoll-Rozada et al., 2012). The KdADP in the presence of 2-HDA and in the control were 51 μM and 45 μM, respectively. (error bars: SD).
