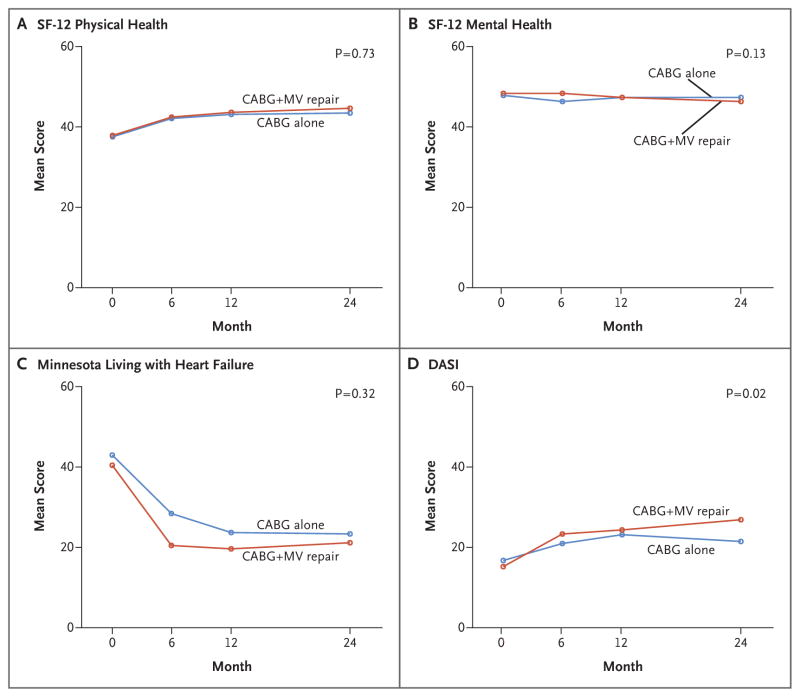
Figure 3. Quality-of-Life Scores.
Shown are the mean scores on the Medical Outcomes Study 12-Item Short-Form General Health Survey (SF-12) for physical health (Panel A) and mental health (Panel B) for patients undergoing either CABG alone or CABG plus mitral-valve repair. The SF-12 scale ranges from 0 to 100, with higher scores indicating better health. Panel C shows mean scores on the Minnesota Living with Heart Failure questionnaire; scores can range from 0 to 105, with higher scores indicating a lower quality of life. Panel D shows mean scores on the Duke Activity Status Index (DASI), on which scores range from 0 to 58, with higher scores indicating a better activity level. On these measures of quality of life, the only significant between-group difference was on the DASI (P = 0.02).

