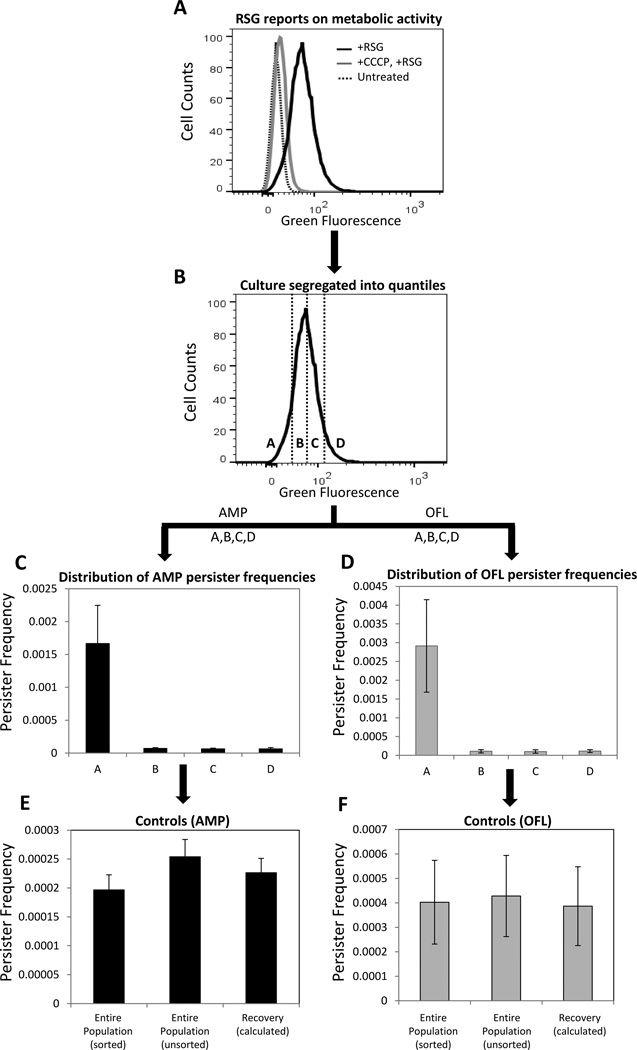
Figure 2. FACS method to study persister metabolism.
(A) Exponential phase cells (E. coli MG1655::ΔcyoA) were stained with RSG. RSG produces a stable green fluorescent signal when reduced by bacterial reductases. Staining was diminished when cells were pre-treated with CCCP, which depletes proton motive force. (B) RSG stained cells were sorted from the indicated regions (gates) in order to quantify the persister distribution within the quantiles. Gates A, B, C and D compromise 10, 40, 40, and 10%, respectively, of the entire population. (C–D) Persister frequencies were quantified after 5h antibiotic treatment of FACS sorted cells from regions A, B, C, and D. The frequency is the ratio of persisters to initial number of FACS sorted cells. (E–F) Persister frequencies in control samples were similarly quantified after 5h antibiotic treatment. “Entire population (sorted)” corresponds to samples that were sorted without gating, “Entire population (unsorted)” corresponds to samples that did not enter the sorter, and “Recovery (calculated)” is the frequency of persisters one would expect from the total population, as calculated from the persister frequencies measured from the segregated quantiles (A, B, C, D). We note that these three quantities should be indistinguishable from one another. Genetic deletion for MG1655::ΔcyoA strain was transduced from the Keio collection using the standard P1 phage method (33) and the mutation was confirmed with PCR.

