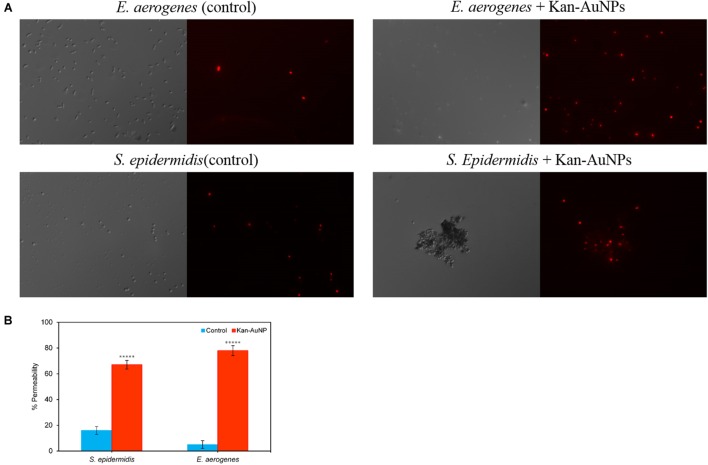
FIGURE 5.
Fluorescence images of Kan-AuNP induced cell membrane permeability using propidium iodide (PI) dye. Upper panel represents Gram-positive bacteria, S. epidermidis, and lower panel represents Gram-negative bacteria, E. aerogenes. (A) For each image, the left half represents differential interference contrast mode, while the right half represents the corresponding fluorescence image. Untreated samples of respective bacteria with Kan-AuNPs were taken as control. (B) Represents a plot showing percentage permeability of S. epidermidis and E. aerogenes bacterial cells in presence and absence (Control) of Kan-AuNPs. ∗∗∗∗∗p ≤ 0.00001 (Student’s t-test, two tailed assuming unequal variances).

