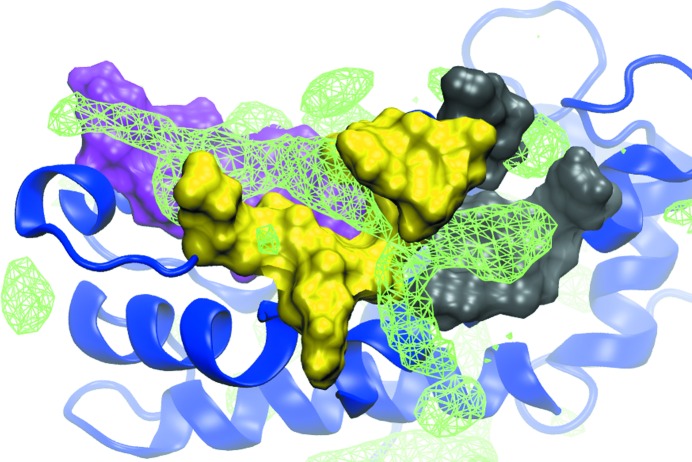
Figure 1.
SILCS Apolar GFE FragMaps. FragMaps (green wire mesh) are shown at a cutoff of −1.0 kcal mol−1 overlaid on the crystal structure of S100B (PDB entry 3gk1). The full protein is represented as a ribbon diagram (blue) with site 1 (magenta), site 2 (yellow) and site 3 (gray) highlighted as solvent-accessible protein surfaces. The presence of Apolar FragMaps in each site indicates the potential for the favorable binding of drug-like molecules, with the extended nature of the site 2 FragMap indicating the potential to link sites 1 and 3 via site 2. Apolar FragMaps were calculated based on the benzene and propane carbon three-dimensional probability distributions.

