Figure 3.
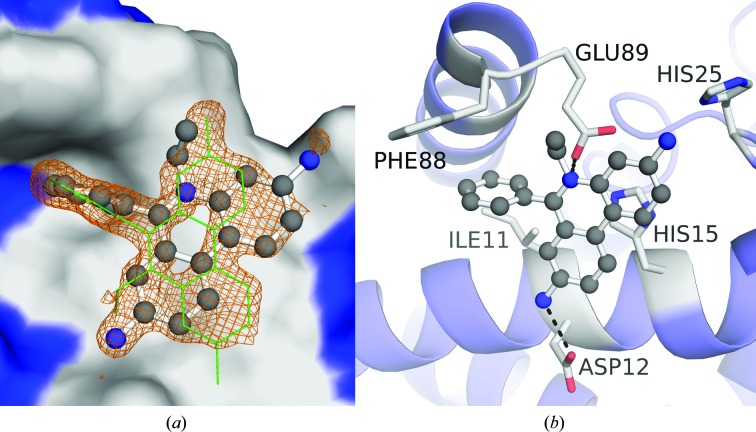
Crystallographic structure of the S100B–SC1990 complex. (a) SC1990 (ball-and-stick representation) is shown within site 3 of the S100B dimer (surface rendering with site 3 highlighted in gray). An |F o| − |F c| electron-density OMIT map (orange) of SC1990 is also shown with the map contoured at the 2.5σ level. Only a single molecule of SC1990 was modeled, but owing to the ligand density sitting on the rotation axis in the crystal symmetry a second symmetry-generated copy (green sticks) is represented so that the entirety of the observed electron density could be interpreted. (b) Dimeric S100B is rendered in a ribbon diagram with residues (sticks) within 4 Å of the SC1990 (ball-and-stick representation) highlighted in gray. SC1990 is situated within the pocket formed by Ile11, Asp12, His15 and His25 of helix 1′ and Phe88 and Glu89 of helix 4. Polar interactions are available with SC1990 at the side chains of Asp12 and Glu89.

