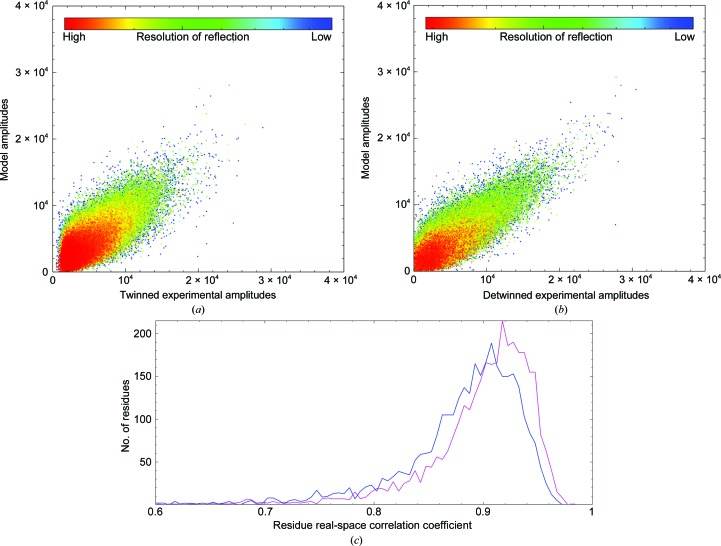
Figure 4.
Amplitude plots between F obs and F calc for the twinned data sets (a) and detwinned data sets (b). The frequency of real-space correlation coefficient per residue is plotted in (c), where the blue line is derived from the map from refinement of the model against the twinned amplitude (the mean correlation is 0.87) and the magenta line is derived similarly from the detwinned amplitudes (the mean correlation is 0.89).

