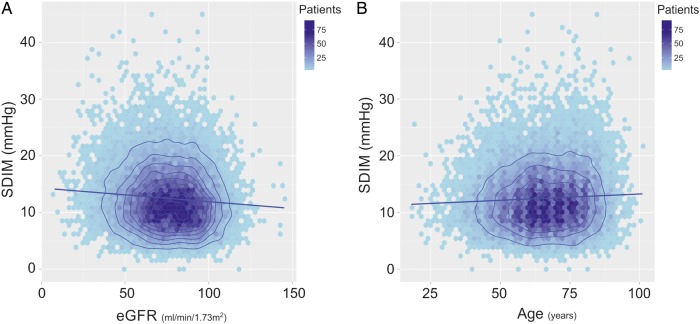
Figure 1.
Renal function and age, both associated with blood pressure variability. Colours indicate the number of data points in each shaded area of the plot. The number of patients represented by each coloured polygon, that is, the data frequency, is indicated by the colour scale. Contours are added to aid visualisation of the shape of the frequency distribution across the two-dimensional plot. The contours are derived from kernel density estimation of the data frequency, and represent the boundaries of intervals of equal magnitude in the data frequency. The regression line is shown. (A) The relationship between SD independent of mean (SDIM) and estimated glomerular filtration rate (eGFR). (B) The relationship between SDIM and age.

