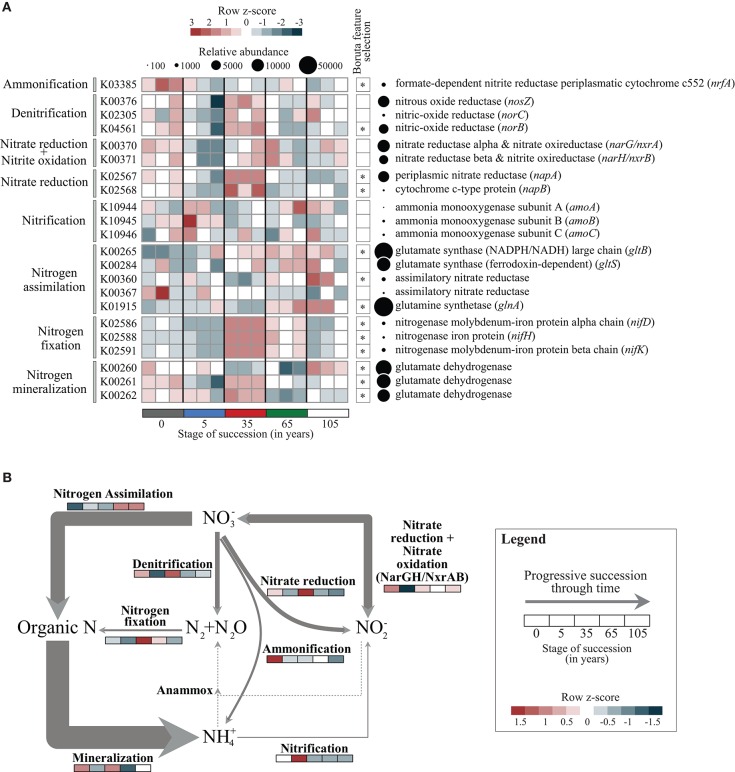
Figure 2.
Distribution of genes involved in the N cycle in salt marsh soils. (A) Distribution of KOs involved in N cycle transformations in samples collected along the salt marsh soil chronosequence. The heatmap displays the relative abundance (row z-scores) of KOs across all samples (triplicate plots per stage of succession). KOs that differentially segregated across soil successional stages were identified by random forest analysis with Boruta feature selection (average z-scores of 1000 runs > 4) (see Supplementary Table 6). Circles are proportional to the relative abundance of each gene family in all samples. (B) Genetic potential for different steps of the N cycle in salt marsh soils using a combination of normalized marker genes (see Materials and Methods and Supplementary Table 3 for details). Arrow sizes are proportional to the genetic potential of the nitrogen transformation (100%, see Supplementary Tables 3, 7 for details). Differences across successional stages of each step are shown by z-score heatmap lines indicated in each N transformation.

