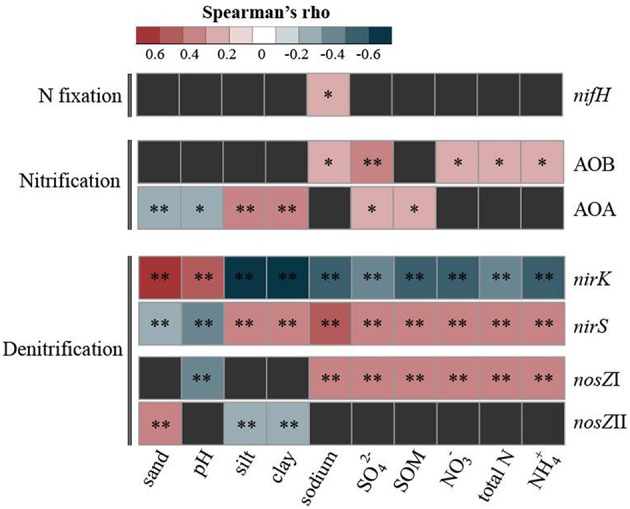
Figure 4.

Correlational analyses between the relative abundance of each N cycling gene and the soil physico-chemical properties. The heatmap displays significant positive (ρ > 0) and negative (ρ < 0) Spearman's correlations. *P < 0.05 and **P < 0.01.
