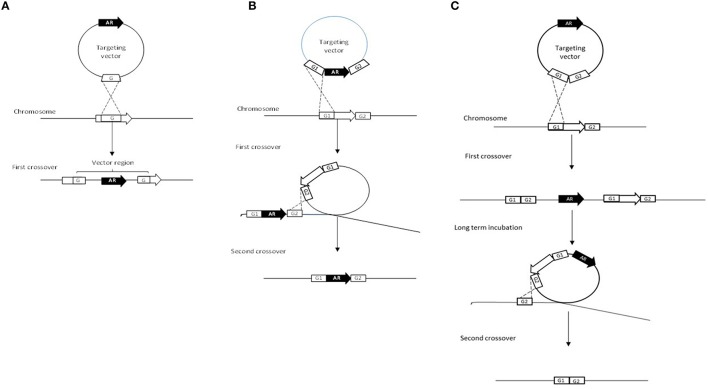
Figure 2.
Schematic representation of targeted gene inactivation approaches. The targeted gene is indicated by an open arrow and homologous regions are indicated as open squares and given the names G1 and G2. The antibiotic resistance gene is indicated as a black arrow with the letters AR. (A) represents the single-crossover plasmid insertion, (B) illustrates the double-crossover gene disruption and finally (C) illustrates the double-crossover markerless gene deletion approach. (Figure was adapted from Fukiya et al., 2012).

