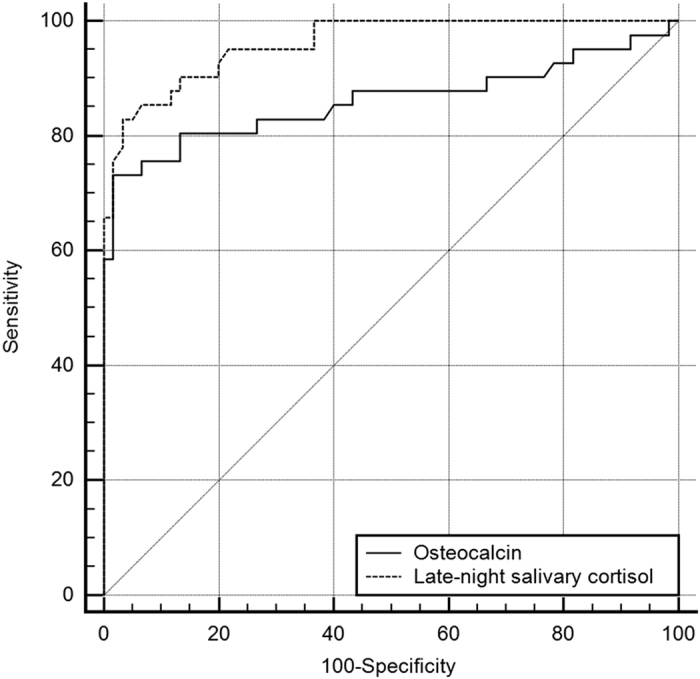
Figure 2.

Direct comparison of areas under the curve (AUC) of osteocalcin (OC) and late-night salivary cortisol (LNSC) to evaluate Cushing's syndrome (CS) in referred population of obese and overweight patients. The diagnostic performance of the OC measurement AUC of 0.859 (95% CI 0.773–0.945) was statistically significantly lower compared with the LNSC AUC of 0.961 (95% CI 0.928–0.994); P=0.015) among the referral population of obese and overweight subjects with suspected CS.
