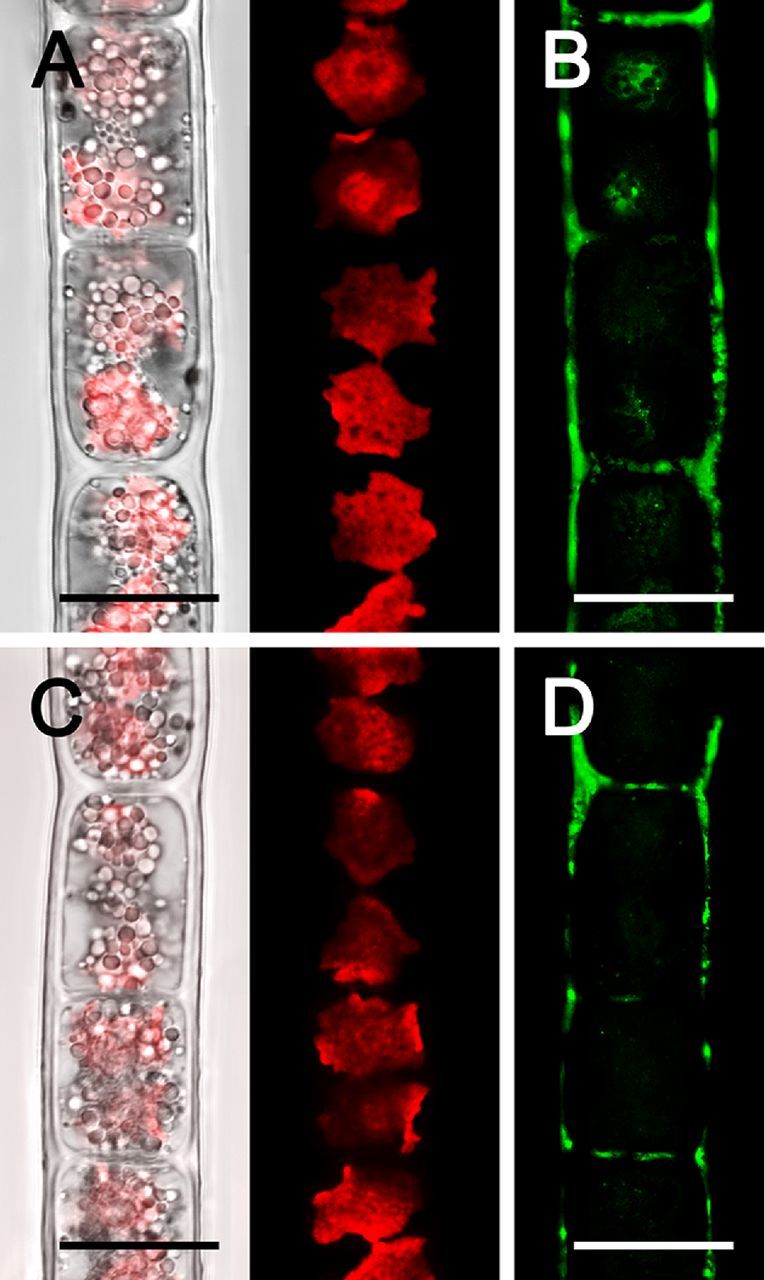
Figure 4.

Confocal laser scanning micrographs (A, C) and morin (green) staining (B, D) of Zygogonium AUT-p (A, B) and Zygogonium AUT-g (C, D). (A, C) Bright field image merged with corresponding chloroplast autofluorescence (red) image. Bars = 20 μm.
