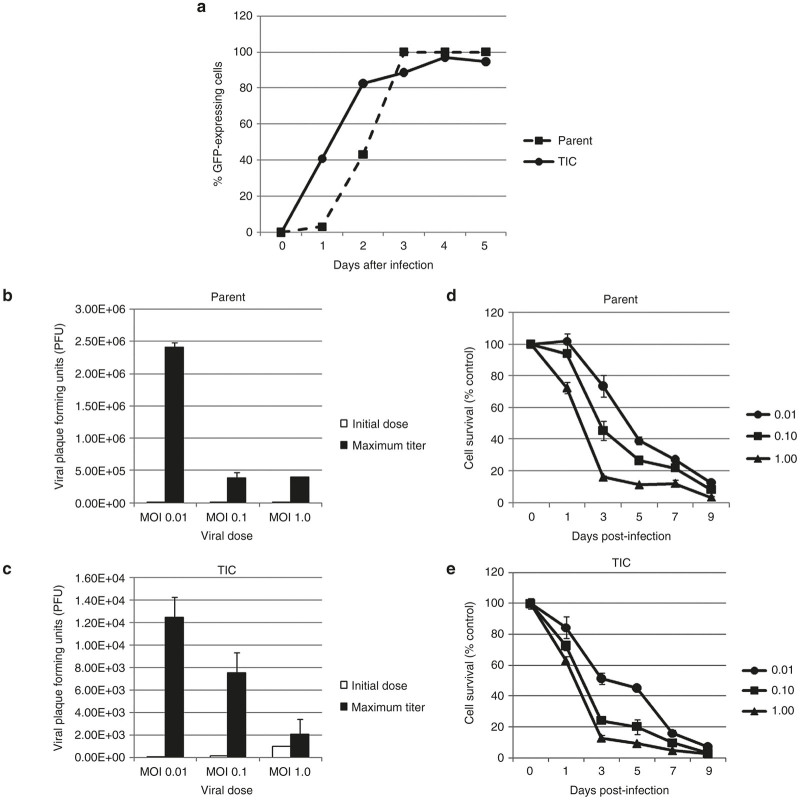
Figure 3.
Green fluorescent protein (GFP) expression increases over time after infection. GFP expression reached and sustained close to 100% expression in both HCT8 parent (dashed line, circles) and tumor-initiating cells (TIC) (solid line, squares) populations. A representative experiment at MOI 0.1 is shown (a). HCT8 parent (b) and TIC (c) cells support viral replication at MOIs of 0.01, 0.1, and 1.0, with exponentially increased viral PFUs on day of maximal burst (black bars) compared to initial doses (white bars). However, viral replication does appear to occur on a different scale between populations. In both HCT8 parent (d) and TIC (e) populations, NV1066 was cytotoxic at MOI of 0.01 (circles), 0.1 (squares), and 1.0 (triangles). Cell kill is represented as percentages of live cells compared to control untreated cells grown under identical conditions. MOI: multiplicity of infection, ratio of viral particles to cells; PFU: plaque-forming units, number of viral particles.

