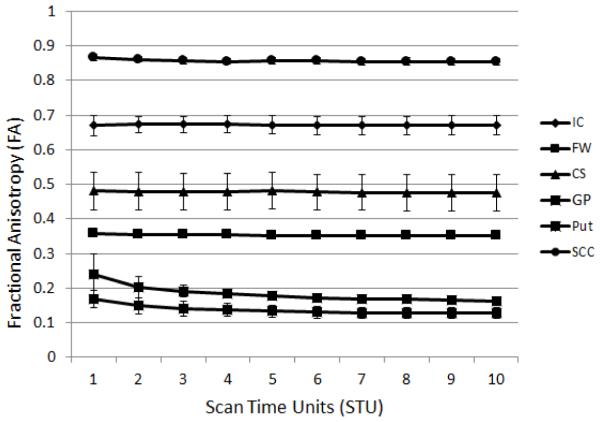
Figure 1.
An example plot of the mean FA values vs. STU for the six different ROI for a single site, in this case GE scanner, TE=99.5ms. Each data point represents the mean of the ROI data from 5 subjects at that site. The ROIs are internal capsule (IC), frontal white matter (FW), centrum semiovale (CS), globus pallidus (GP), putamen (Put), and the splenium of the corpus callosum (SCC).Contrasts between the distribution of ROI FA and MD values for each condition were calculated for all of the contrasts in Table 1. An example of the resulting p-values for a single contrast is show in Table 2.

