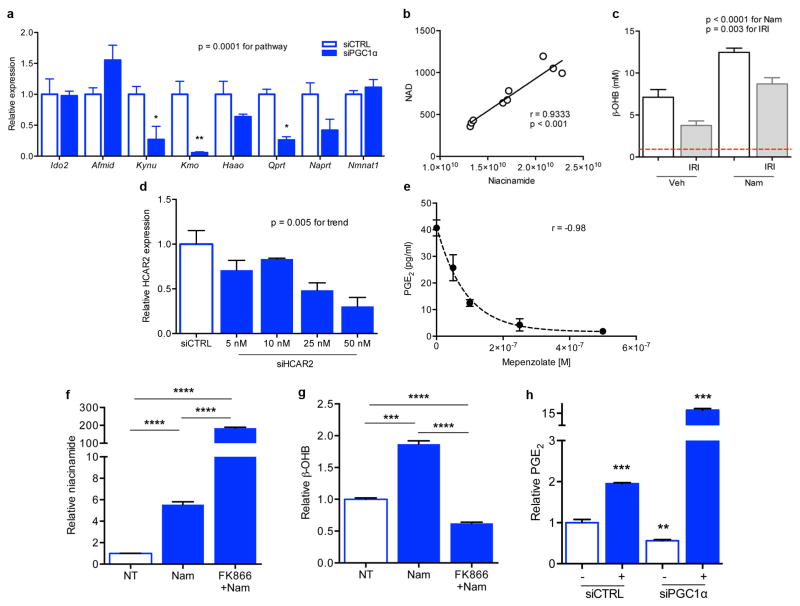
Extended Data Fig 6. PGC1α-dependent de novo NAD biosynthesis and NAD-dependent accumulation of β-OHB and PGE2.
a, Gene expression for de novo NAD biosynthetic pathway in renal tubular cells 48 h after control vs. PGC1α knockdown (n=3/group). The gene expression set corresponds to the eight transcripts whose abundance was measured in kidney homogenates in Figure 3. P=0.0001 by two-way ANOVA with Bonferroni-corrected comparisons as indicated. b, Correlation of renal Nam vs. renal NAD in mice treated with vehicle or different doses of Nam (100–400 mg/kg IP × 1). Arbitrary units on X- and Y-axes. c, Renal β-OHB concentrations in kidneys of mice following vehicle (Veh) vs. Nam treatment (400 mg/kg IP × 4 d) with and without IRI 24 h prior to tissue collection (n=5/group). P-value by two-way ANOVA. Dashed line indicates normal circulating concentration of β-OHB. d, Dosing for siRNA against HCAR2 in renal tubular cells. e, Dose-inhibition curve in renal tubular cells for PGE2 release following 24 h of mepenzolate bromide at the indicated concentrations (n=3 replicates per concentration).32–34 f,g Intracellular Nam and secreted β-OHB for renal tubular cells following treatment with Nam (1 μM for 24 h) with or without pre-treatment with the NAMPT inhibitor FK866 (10 nM, n=6/group). h, PGE2 in conditioned media of renal tubular cells after control vs. PGC1α knockdown and with and without exogenous β-OHB application (+, 5 mM, n=6/group, p values vs. control group). Error bars SEM, *p<0.05, **p<0.01, ***p<0.001, and ****p<0.0001.

