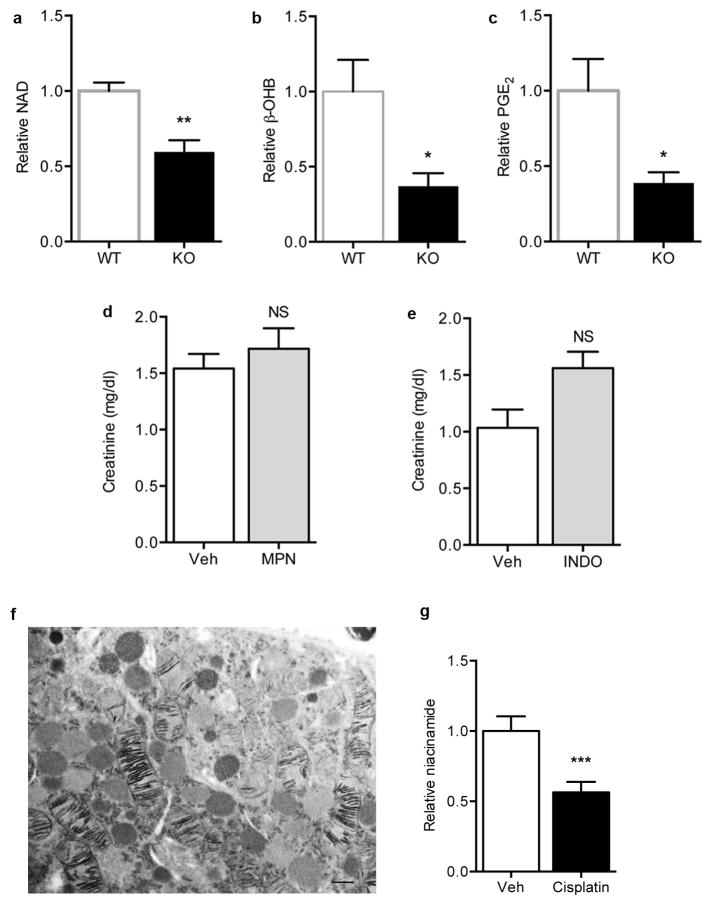
Extended Data Fig 7. Effects of PGC1α on renal metabolites and features of cisplatin nephrotoxicity.
a–c, Relative renal NAD, β-OHB, and PGE2 concentrations in WT littermates vs. PGC1α−/− (KO) mice (n=6/group). d, Serum creatinine in genetic control mice for iNephPGC1α 24 h after IRI with vehicle vs. mepenzolate (MPN, 10 mg/kg IP) treatment (n=5/group). e, Serum creatinine in genetic control mice for iNephPGC1α 24 h after IRI with vehicle vs. indomethacin (INDO, 10 mg/kg IP) treatment (n=6/group). f, Transmission EM with cytochrome c oxidase enzyme histochemistry of proximal tubular cell 24 h following cisplatin exposure (25 mg/kg IP) demonstrating mitochondrial injury. Scale bar 500 nm. g, Relative renal Nam concentrations following cisplatin as in f. Error bars SEM, *p<0.05, **p<0.01, ***p<0.001.

