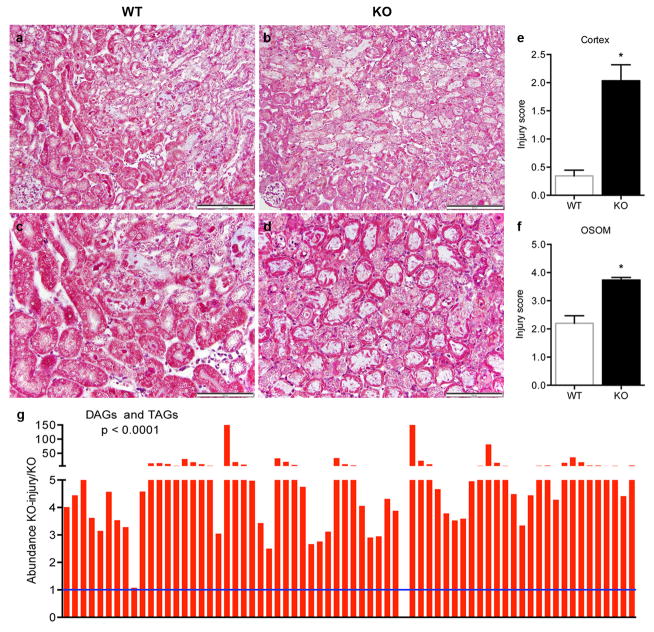
Extended Data Fig 2. Exacerbation of fat accumulation and tubular injury in post-ischemic PGC1α−/− kidneys.
a–d, Low (a,b) and high-power (c,d) photomicrographs 24 h after IRI in WT vs. PGC1α−/− (KO) mice. Scale bars 100 and 50 μm. e,f, Blinded scoring of tubular injury in cortex and outer stripe of outer medulla (OSOM) on 4-point injury scale as described in Methods (n=8 WT vs.12 KO mice), *p<0.05. g, Di-/tri-acylglycerols (DAGs, TAGs) in renal homogenates of KO mice at baseline and 24 h after injury (n=6/group). Each bar represents one lipid species. P-value by two-way ANOVA. Error bars SEM.

