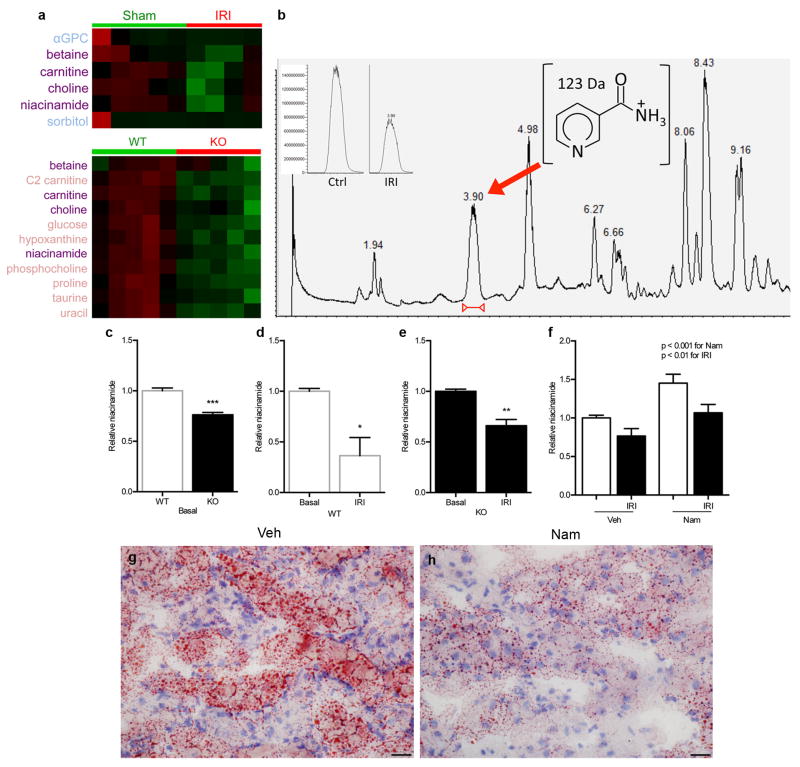
Extended Data Fig 3. Niacinamide (Nam) reduction from IRI and PGC1α deficiency.
a, Heatmaps (red=higher, green=lower) of Bonferroni-corrected significantly different metabolites in sham vs. IRI kidneys and WT vs. KO kidneys. Metabolites listed in purple are shared between settings. b, Total ion chromatogram of polar, positive ion mode method for representative WT-IRI sample, with niacinamide (Nam) peak at retention time = 3.88 minutes. Inset shows representative niacinamide peaks for kidney extracts from WT control (Ctrl) and WT-IRI (IRI) mice. c–e, Relative renal Nam abundance in kidneys of KO mice vs. WT littermates; WT littermates at baseline and 24 h after IRI; and KO mice at baseline and 24 h after IRI (n=6/group). f, Relative renal Nam concentrations in kidneys of mice following vehicle (Veh) vs. Nam treatment (400 mg/kg IP × 4d) with and without IRI 24 h prior to tissue collection (n=6/group). P-values by two-way ANOVA. g,h, Oil Red O stain (pink) for fat accumulation 24 h after IRI with or without Nam pretreatment (400 mg/kg IP × 4 d), scale bar 20 μm. Error bars SEM, *p<0.05, **p<0.01, ***p<0.001.

