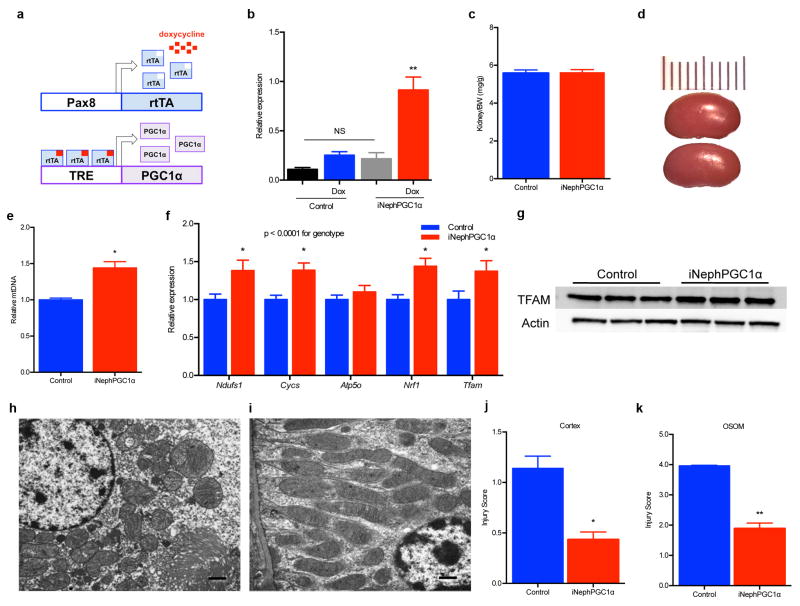
Extended Data Fig 4. Increased mitochondrial abundance and post-ischemic protection in renal tubular epithelial transgenic mice (iNephPGC1α).
a, Schematic for generating iNephPGC1α mice. b, Relative renal PGC1α expression in controls vs. iNephPGC1α mice with and without 4 weeks of doxycycline in drinking water (n = 5/group, **p<0.01 vs. all other groups). c, Ratio of kidney weight to total body weight (note body weights statistically indistinguishable as well, n=4/group). d, Example gross images with 1 cm scale of control vs. iNephPGC1α kidney. e, Renal mitochondrial DNA (mtDNA) copy number as described in Methods. f, Relative renal gene expression of PGC1α targets (Ndufs1, Cycs, Atp5o), partnering transcription factors (Nrf1), and the mitochondrial transcription factor, TFAM. Results analyzed by two-way ANOVA with p-value for genotype as noted. N=8/group. *p<0.05 vs. control after Bonferroni correction. g, Western analysis of kidney lysates for Transcription Factor A, Mitochondrial (TFAM)37 and loading control. h,i, Transmission EM of mitochondria sectioned perpendicular and parallel to long axis demonstrating normal morphology in iNephPGC1α mice (representative of n=4/group), scale bar 500 nm. j,k, Blinded scoring of tubular injury in cortex and outer stripe of outer medulla (n=8 control; 12 iNephPGC1α). Error bars SEM, *p<0.05, **p<0.01.

