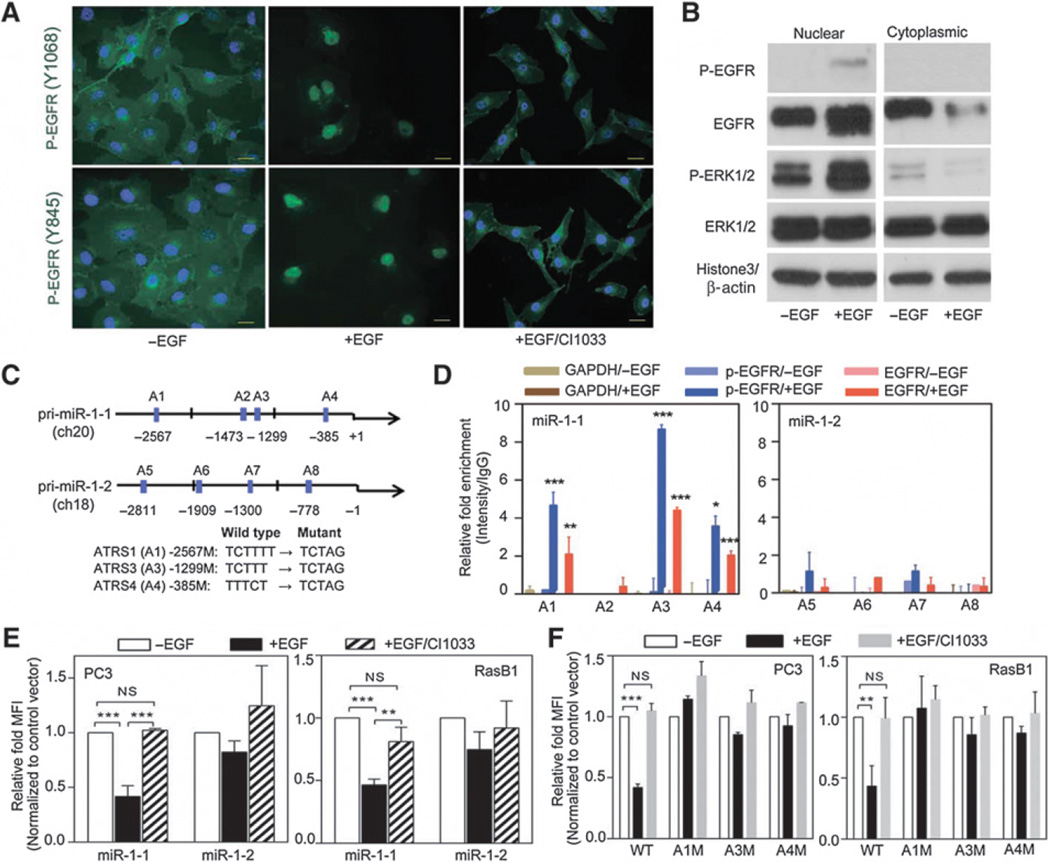
Figure 3.
Nuclear EGFR directly binds to pri-miR-1-1 promoter and regulates miR-1 transcription. A, immunofluorescent staining of RasB1 cells with antibodies for p-EGFR (Y1068 or Y845) following EGF treatment. Nuclei were visualized with DAPI staining (blue). Scale bars, 50 µm. B, immunoblotting of nuclear (left) and cytoplasmic (right) cell extracts from RasB1 cells following EGF treatment. C, schematic of the predicted ATRSs in the pri-miR-1-1 and pri-miR-1-2 stem-loop promoters. D, ChIP analyses of predicted ATRSs in the pri-miR-1-1 and pri-miR-1-2 promoter regions of RasB1 cells following EGF treatment. Enrichment of each protein at each site is given as a percentage of the total input, which was then normalized to each IgG. E, promoter analyses of PC3 and RasB1 cells transiently transfected with the pri-miR-1-1 or pri-miR-1-2-RFP reporter following EGF and CI1033 treatment. Relative fold of MFI is given as normalization to a control vector. F, promoter analyses of PC3 and RasB1 cells transiently transfected with the wild-type or mutated pri-miR-1-1-RFP reporter following EGF and CI1033 treatment. Data are presented as mean ± SEM; n = 3. *, P < 0.05; **, P < 0.01; ***, P < 0.001.

