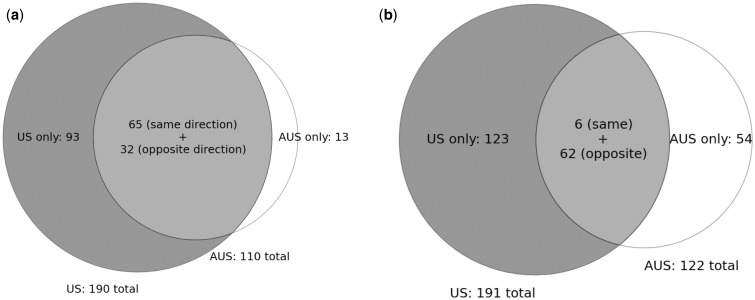
Fig. 3.
Venn diagrams of differentiated CNVs detected in Drosophila melanogaster and D. simulans. (a) Drosophila melanogaster. Differentiated CNVs detected in the United States are represented by the gray circle, whereas those detected in Australia are in the white circle. The intersection represents all CNVs differentiated on both continents, whether in the same or opposite directions with respect to distance from the equator. The much lower number of CNVs differentiated only in Australia is likely due to the lack of paired-end reads from these samples. (b) Differentiated CNVs detected in D. simulans.

