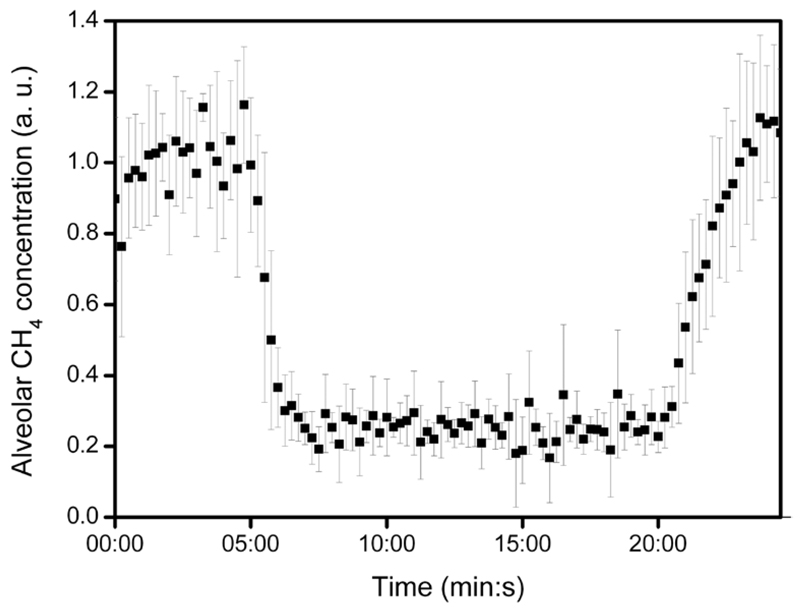
Figure 2.
Relative changes of alveolar methane concentration during ergometer test: 5 min rest—15 min workload—5 min rest (recovery). Note that the average of the measurements of 5 subjects (normalized with the pre-exercise average per individual) is indicated. Error bars show standard deviation of data. The alveolar methane concentration was estimated from mixed expired concentration as given in section 2.4.

