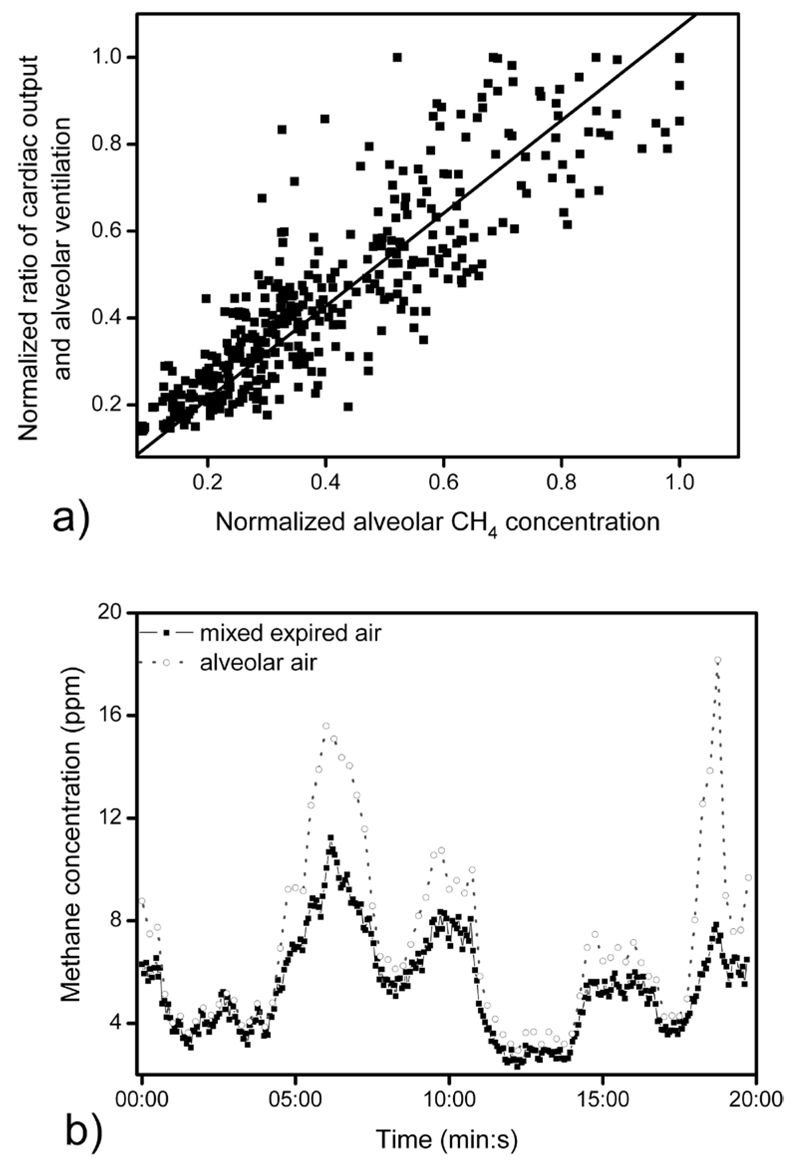
Figure 5.
(a) Alveolar methane concentration as a function of the inverse of the ventilation-perfusion ratio of a female subject (26 years) during forced hypo- and hyperventilation at rest. All data were normalized against the subject’s initial values (obtained during normal ventilation). Solid line indicates linear regression (n = 398, R = 0.886, p < 0.001). (b) A typical example of methane concentration in mixed expired and alveolar air during hypo- and hyperventilation. The alveolar methane concentration, alveolar ventilation, and cardiac output were estimated as given in sections 2.4 and 2.5.

