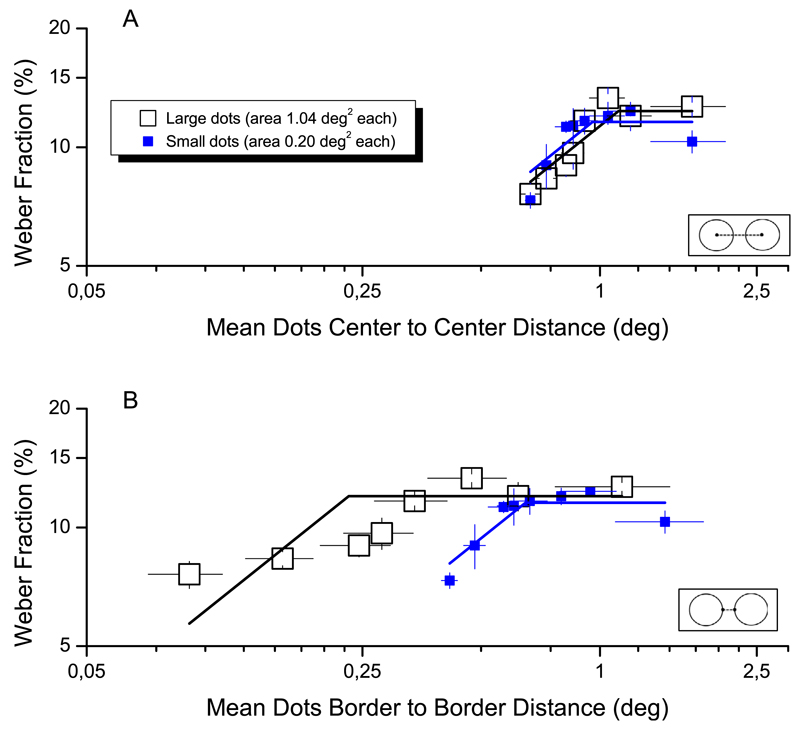
Figure 6.
Weber fractions as a function of inter-dot distance. Weber fractions for numerosity are plotted as a function of average center-to-center inter-dot distance (A) or average border-to-border distance (B). As in Figure 4, large open squares refer to patches stimuli made by large dots (area of 1.04°), small filled symbols to small dots (diameter of 0.25°). Continuous lines represent two-limb piecewise linear functions which have slope 2α until knee point and are flat thereafter.

