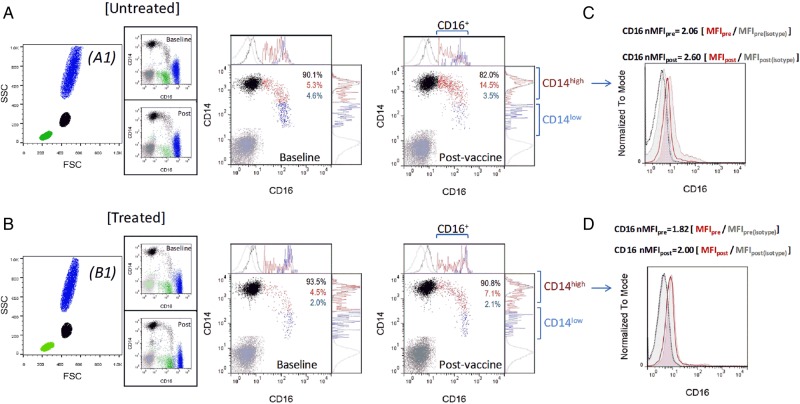
Figure 1.
Representative flow cytometry data. Dot plots representative of untreated (A) and treated (B) participants are shown. Expression of CD14 and CD16 was analysed within the monocyte gated population identified on a FSC vs. SSC plot (A1 and B1, in black), enabling distinction of CD14highCD16− (black), CD14highCD16+ (red), and CD14lowCD16+ (blue) cells (the isotype control is in grey). Expression of CD16 and CD14 is shown in the ungated population for completeness in the side panels A1 and B1, representing monocytes (black, CD14+), neutrophils (blue, CD14−CD16high), and lymphocytes (green, CD14−CD16low, likely NK cells). Since significant differences between groups were observed in the prevalence and cell number of CD14highCD16− (black) and CD14highCD16+ (red) subsets, the level of CD16 expression was also specifically analysed within the CD14high population, using an nMFI strategy. The histograms (C and D) show overlay of the baseline (empty histogram) and post-vaccination (filled histogram) intensity of fluorescence for CD16 of the stained samples (red). Also shown are the fluorescence levels of the antibody isotype controls (in grey, with dotted histogram and filled histogram for baseline and post-vaccination samples, respectively). The median fluorescence intensity (MFI) calculated in CD14high monocytes at baseline (pre) and post-vaccination (post) was normalized by the MFI of the corresponding isotype control as indicated in the figure.

