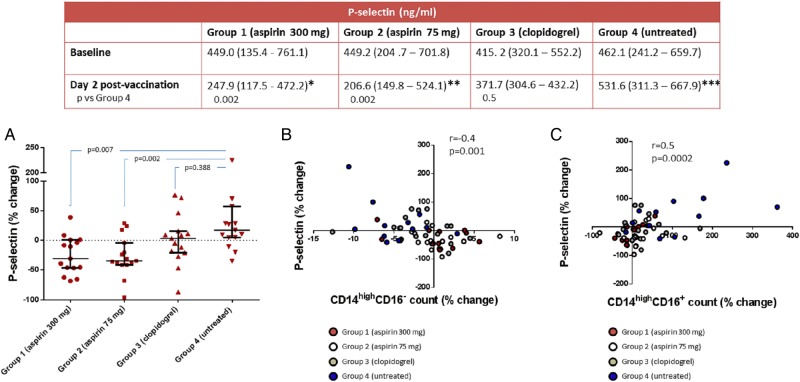
Figure 4.
Modulation of P-selectin correlates with change in monocyte phenotype. The table shows the P-selectin values at baseline and post-vaccination stratified among groups, with P-values calculated using rank ANCOVA. Percentage change from baseline of P-selectin in each group is shown in graph A. B and C report the correlation between change in P-selectin and change in classical CD14highCD16− and intermediate CD14highCD16+ monocyte cell count, respectively. Values are reported as median and IQR. *P = 0.003; **P = 0.011; ***P = 0.039 vs. baseline within groups using Wilcoxon matched-pairs signed-rank test.

