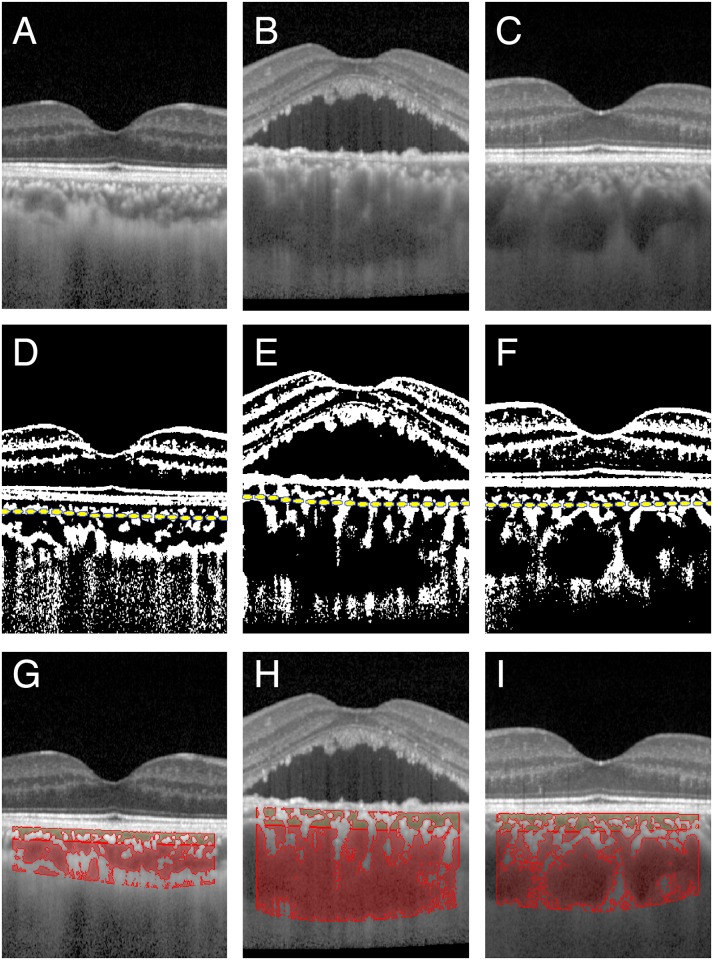
Fig 1. Spectral domain optical coherence tomographic (SD-OCT) images of an eye with central serous chorioretinopathy, of the normal fellow eyes, and normal control eyes.
SD-OCT images of a control eye (A, D and G), an eye with central serous chorioretinopathy (CSC; B, E, and H), and the fellow eyes of a patient with unilateral CSC (C, F, and I) are shown. The original OCT images (A-C), binarized images (D-F), and the images in which the hyporeflective areas are outlined in color are shown (G-I). Yellow dashed lines indicate the segmentation lines between the inner and outer choroid (middle row). The area outlined in dark yellow represents the hyporeflective area in the inner choroid and the one in dark red represents the hyporeflective area in the outer choroid.

