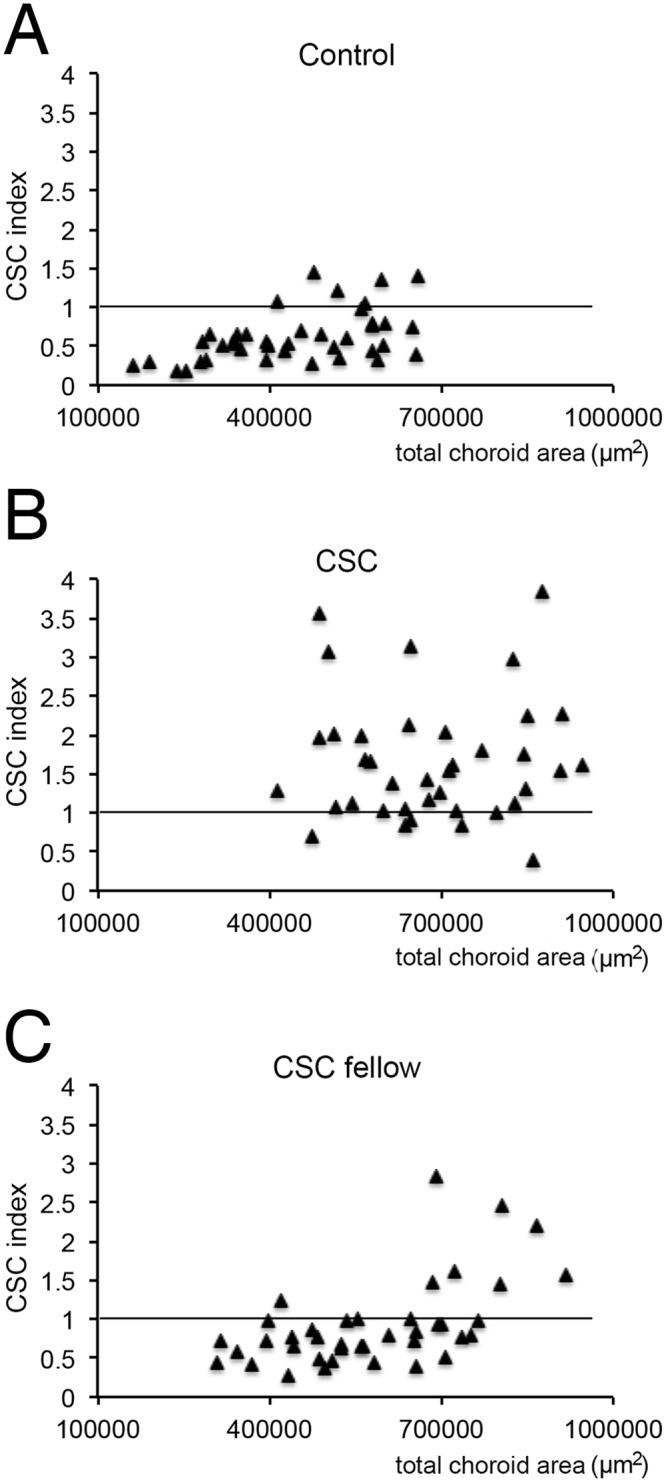
Fig 4. Scatterplots of CSC index as a function of the total choroidal area for each type of eyes.

Scatterplot of the eyes for the total choroidal area (X-axis) and CSC index (Y-axis) is shown. In controls, the choroidal area was distributed at a lower range than CSC eyes, and the CSC index was distributed at a lower range than CSC eyes (A, B). CSC-fellow eyes were between these two groups from either point (C).
