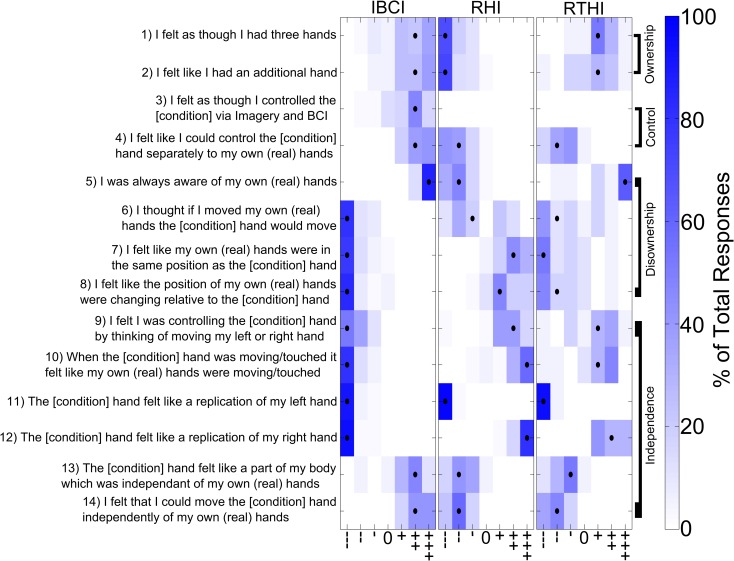
Fig 2. The questions and responses for the different experimental conditions.
Subjects were asked to complete the questionnaire immediately after each experimental condition using a seven-step visual-analogue scale ranging from strongly agree (+++) to strongly disagree (---). The black dots indicate the median responses and the colour scale indicates the percentage of the total responses. For the real questionnaires given to subjects the [condition] of each statement was substituted with “virtual” for IBCI and “rubber” for RHI or RTHI. See also Table 1 for statistical comparisons between different experimental conditions.

