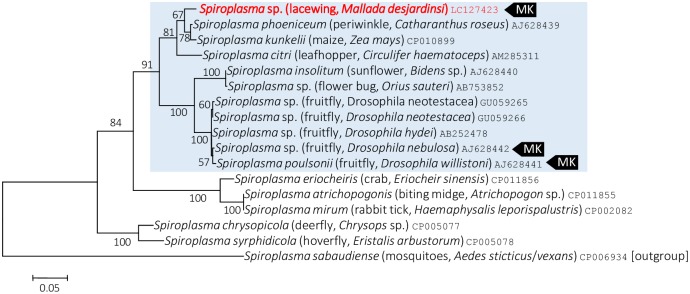
Fig 6. Phylogenetic position of M. desjardinsi Spiroplasma among Spiroplasma bacteria and relatives based on spot gene sequences.
A maximum likelihood tree (lnL = −2525.6794) is shown. Bootstrap probabilities are given at the nodes. M. desjardinsi Spiroplasma is depicted as red. The scale bar indicates the number of nucleotide substitutions per site. A clade containing S. poulsonii, S. insolitum, S. kunkelii, S. phoeniceum, S. citri and S. melliferum is shaded with light blue. A host organism is given in parenthesis. An accession number is given at the end of each OTU. MK represents a male-killer.

