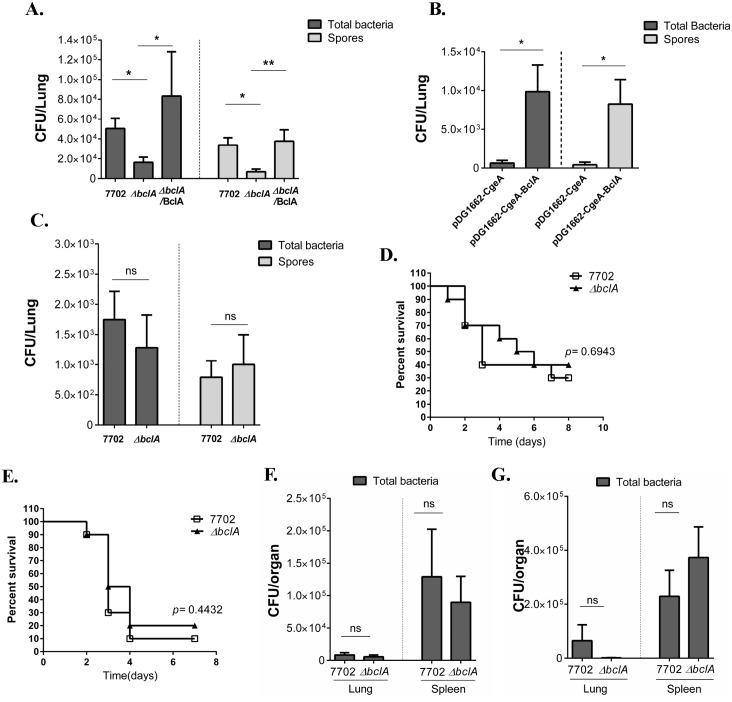
Fig 4. BclA significantly promoted spore persistence in the mouse lungs.
Mice were i.n. inoculated with sub-lethal doses of various spores. Lungs were collected, homogenized and either dilution plated to determine the total viable bacterial counts, or heated at 68°C and dilution plated to determine the spore counts. (A). C57BL/6 mice were i.n. inoculated with ~1×10⁸ spores of 7702, ΔbclA or ΔbclA/BclA per mouse. Lungs were collected 2 weeks post inoculation. Data shown were combined from at least two independent experiments (7702, n = 12; ΔbclA, n = 7; ΔbclA/BclA, n = 4). (B) Balb/c mice were i.n. inoculated with ~ 1.5 ×10⁷ spores per mouse of B. subitilis containing pDG1662 vector (n = 20) or pDG1662-BclA (n = 20). Lungs were harvested at one week post inoculation. Data shown were combined from two independent experiments. (C). C3-/- mice were more susceptible to B. anthracis than C57BL/6. Therefore, a sub-lethal dose of ~ 5×10⁵ spores/mouse was used for i.n. inoculation of C3-/- mice. Lungs were collected at 2 weeks post inoculation. Data shown were combined from at least two independent experiments (7702, n = 14; ΔbclA, n = 12). (D—G) Mice were i.p. inoculated with lethal doses of 7702 or ΔbclA spores. (D) C57BL/6 mice were inoculated with ~1×10⁸ spores/mouse of 7702 (n = 10) or ΔbclA (n = 10) and survival monitored. Data shown were combined from two independent experiments. (E) C3-/- mice were inoculated with ~5×10⁶ spores/mouse of 7702 (n = 11) or ΔbclA (n = 11). Data shown were combined from two independent experiments. (F) Bacterial burden in the lungs and spleen of C57BL/6 mice inoculated with ~1×10⁸ spores of 7702 (n = 10) or ΔbclA (n = 10) at 48 hours post inoculation. Data shown were combined from two independent experiments. (G) Bacterial burden in the lungs and spleen of C3-/- mice inoculated with ~5×10⁶ spores of 7702 (n = 6) or ΔbclA (n = 4) at 48 hours post inoculation. Data shown were combined from two independent experiments. *, p < 0.05; **, p < 0.01; ****, p < 0.0001; t test. Analysis of survival curves was done using Log-rank test.

