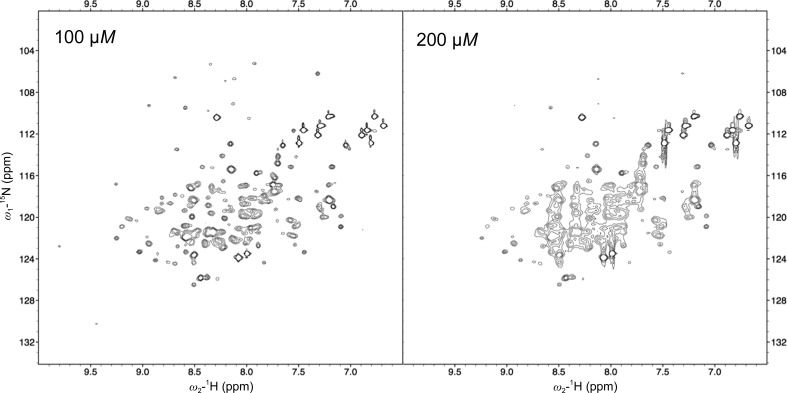
Figure 2.
1H–15N HSQC spectrum of 100 µM (left) and 200 µM (right) Os01T0156300 protein at 298 K using a Bruker Avance III HD 800 MHz spectrometer equipped with a 1H/13C/15N TXI CryoProbe (Bruker BioSpin). Uniformly 15N-labelled Os01T0156300 protein was prepared in buffer consisting of 10 mM HEPES pH 7.5, 1 mM DTT, 10% D2O. The spectrum was processed using the NMRPipe software package (Delaglio et al., 1995 ▸).

