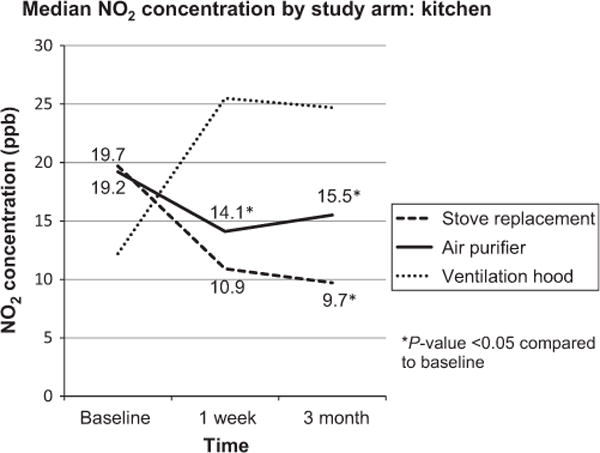
Fig. 2.

NO2 concentrations by study arm: kitchen. Displays median kitchen NO2 concentration for each study arm (stove replacement, air purifier, and ventilation hood) at baseline, 1-week, and 3-month follow-up. (NO2 = nitrogen dioxide, ppb = parts per billion)
