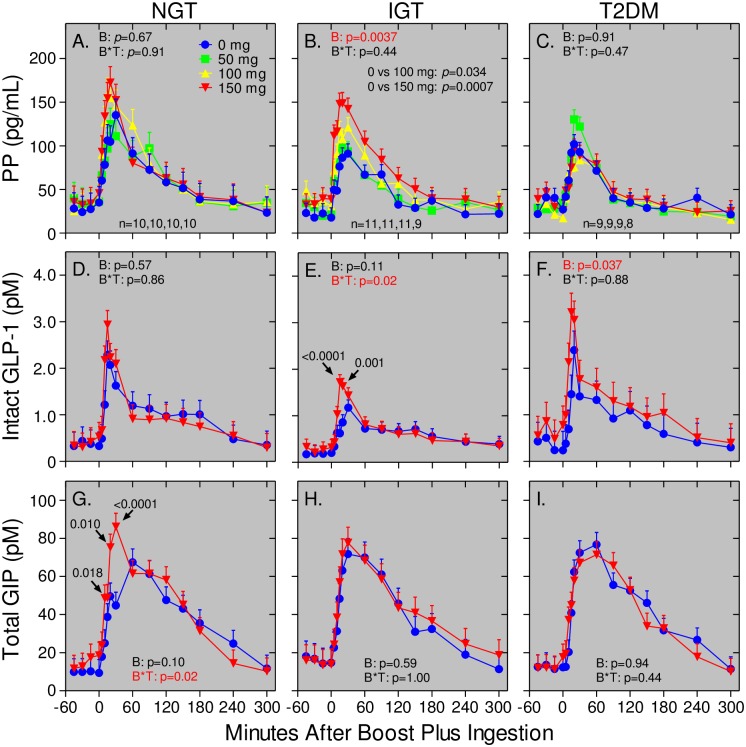
Fig 3. Bethanechol differentially affects PP, GLP-1, and GIP responses in humans with NGT, IGT, and T2DM.
Subjects with NGT, IGT, and T2DM were administered separate meal tolerance tests with placebo (blue dots) or bethanechol at a dose of 50 mg (green squares), 100 mg (yellow triangles), or 150 mg (inverted red triangles). Plasma levels of PP (Panels A-C), intact GLP-1 (Panels D-F), and total GIP (Panels G-I) were measured at the indicated times before and after meal ingestion. Values represent group means ± SEMs for subjects with NGT (Panels A, D, G), IGT (Panels B, E, H), and T2DM (Panels C, F, I). The number of subjects receiving the 0, 50, 100, and 150 mg dose of bethanechol is indicated for each group. Differences in subject number within each group are because several subjects did not receive the 150 mg dose. GLP-1 and GIP levels were only measured in samples from individual subjects receiving both the 0 mg and 150 mg doses of bethanechol. P values for the bethanechol effect (B) and for bethanechol-time interaction (B*T) are indicated in each panel. Statistically significant P values for individual time points are shown if the bethanechol or bethanechol-time interaction was significant.

