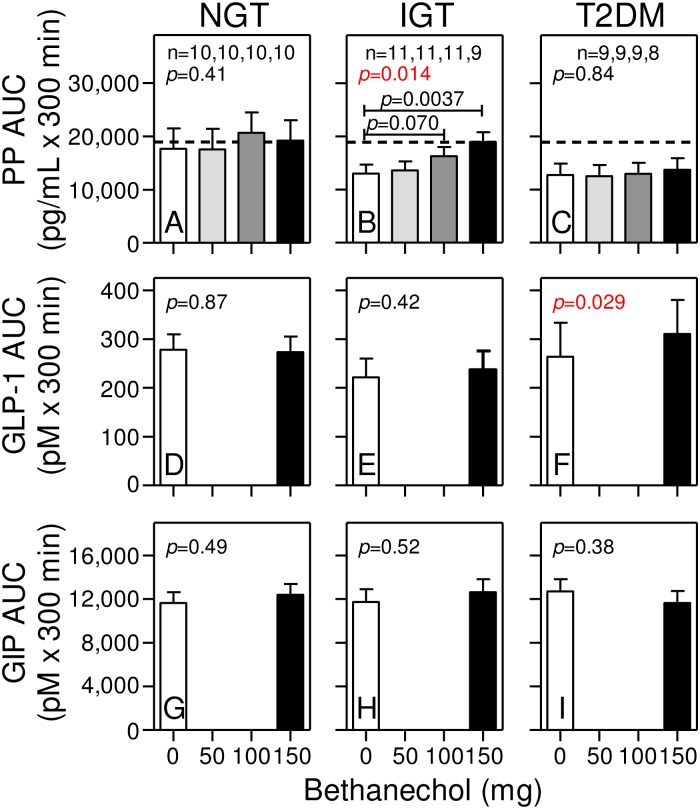
Fig 4. Bethanechol increases the PP AUC only in humans with IGT.
Areas under the curve (AUC) were calculated for each individual at the indicated dose of bethanechol from data shown in Fig 3. Group means ± SEM are shown. P values for a bethanechol effect were determined using the mixed effects model and are shown in each panel. Statistically significant p values for each dose of bethanechol versus placebo are shown only if the bethanechol effect is significant.

