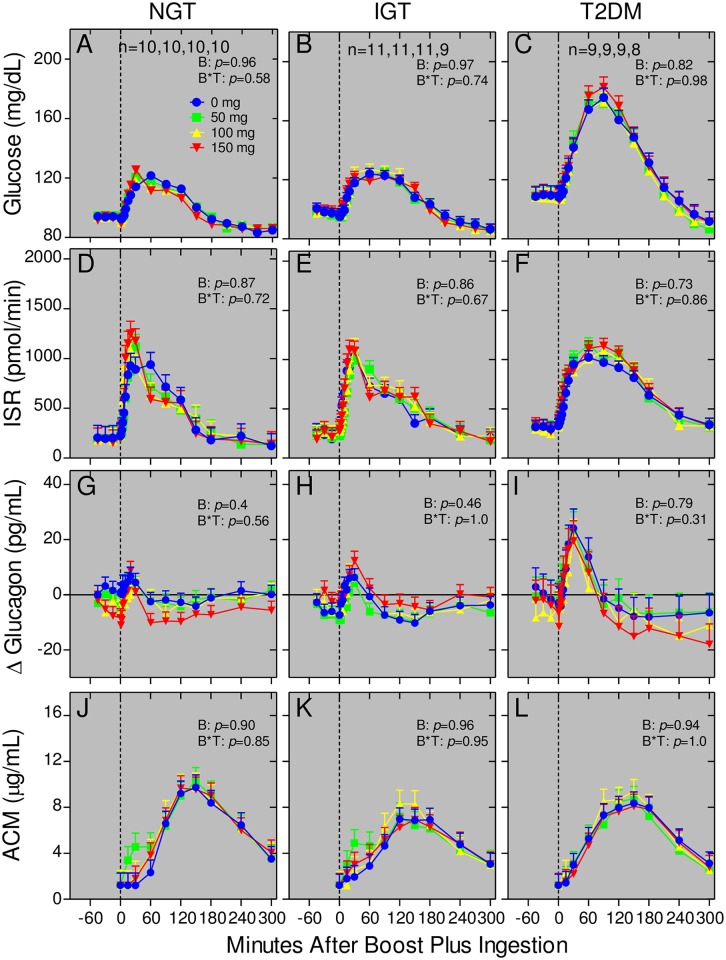
Fig 7. Bethanechol has no effect on glucose homeostasis in humans with NGT, IGT, and T2DM.
Plasma glucose (panels A-C), glucagon (panels G-I), and ACM (panels J-L) levels and insulin secretion rates (panels D-F) were determined during meal tolerances as described in Fig 3. Values represent group means ± SEMs for subjects with NGT (Panels A, D, G, J), IGT (Panels B, E, H, K), and T2DM (Panels C, F, I, L). Symbols are the same as in Fig 4. P values for bethanechol and for bethanechol-time interaction are indicated in each panel. Data for the 100 mg dose of bethanechol for one subject with T2DM was excluded from the analysis because baseline values were 4.5 standard deviations from the mean.

