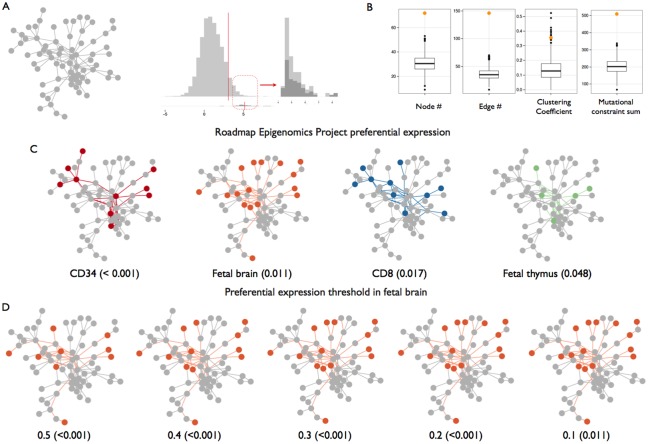
Fig 2. selectively constrained genes form a 72-member network, preferentially expressed in fetal brain, heart and immune cell populations.
A: constrained genes form a connected subnetwork of genes in the extreme of the constraint score distribution. B: the constrained subnetwork contains more genes (node p < 0.001), has more connections (edge p < 0.001), is more densely connected (clustering coefficient p = 0.008) and explains more total constraint (sum p < 0.001) than expected by chance (orange dots) compared to networks discovered in 1000 permutations of the constraint data (boxplots and black dots). C: the constrained subnetwork is preferentially expressed in a subset of Roadmap Epigenome Project tissues, including fetal brain. Preferentially expressed nodes and the shortest paths connecting them are in color; grey nodes are not preferentially expressed in each displayed tissue. D: The most consistent preferential expression signal is seen in fetal brain, which is robust to stringency of preferential expression threshold.

