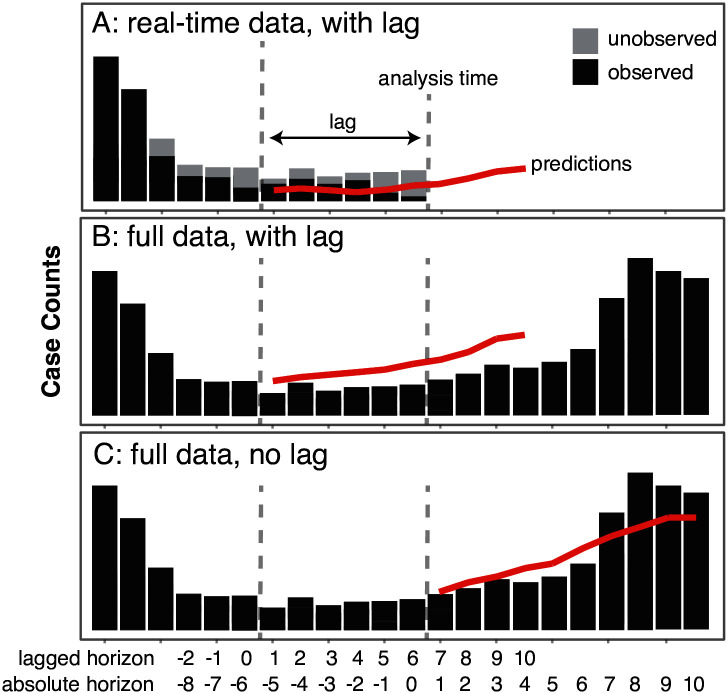
Fig 2. This figure illustrates three different methods used to create forecasts.
Panel A shows predictions made using only data that was available at the analysis time, and ignoring the most recent six biweeks of reported cases. Panel B shows predictions that used fully observed data (including data that was not available at the analysis time) but still ignored cases from the six biweeks preceding the analysis time. Panel C shows predictions that could have been made at the analysis time if no reporting delays existed and all data that eventually was reported had been available in real-time.

