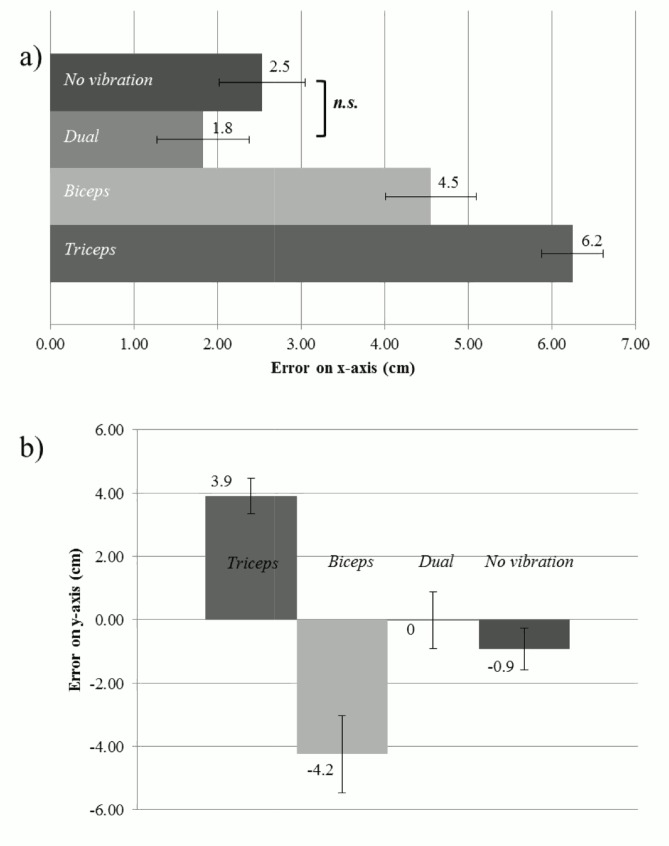
Fig 3.
Effects of vibration on displacement values on x- (a) and y- (b) axis. ‘0’ represents the position of the target finger on the right surface of the panel. The scores represent the mean error of the pointing task on the X (a) and Y (b) axes and the bars represent the standard error. For each histogram bar the mean is displayed.

