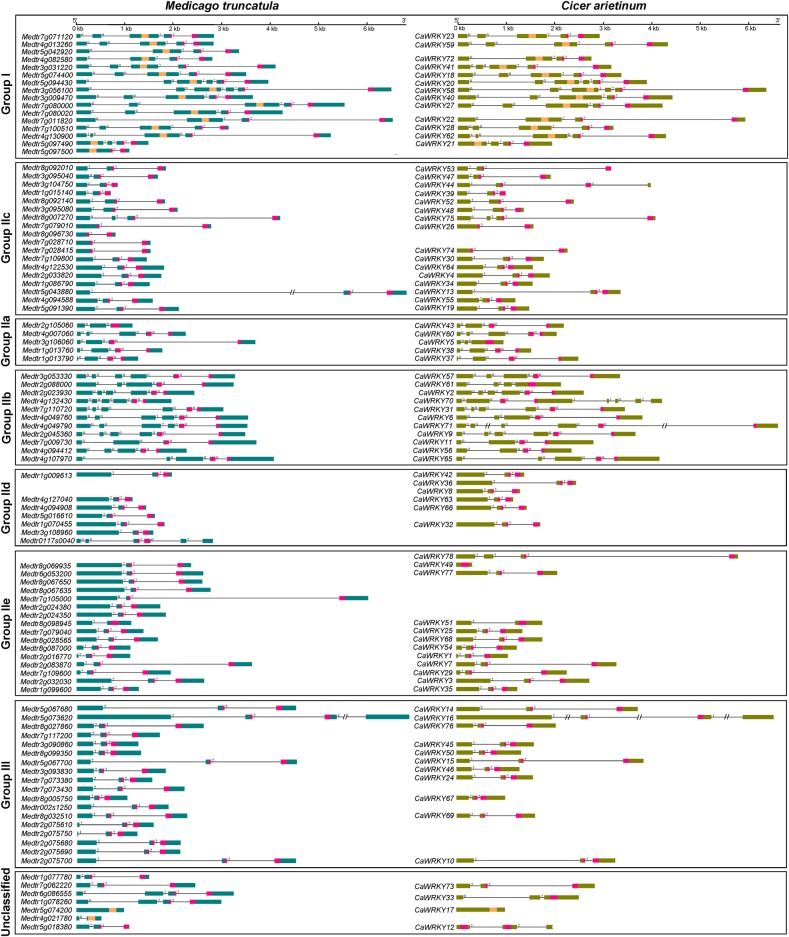
Figure 2.
Gene structure of M. truncatula and C. arietinum WRKY genes. For each gene, the boxes represent exons and black lines connecting them are introns. The shaded boxes in some exons of a gene represent WD-encoding regions. The N-terminal and C-terminal WD-encoding exonic regions of group-I are highlighted with different shades. The numbers 0, 1, and 2 at the start of each intron indicate its phase. The introns marked with symbol (//) were reduced in size to adjust image. This figure is available in black and white in print and in colour at DNA Research online.

