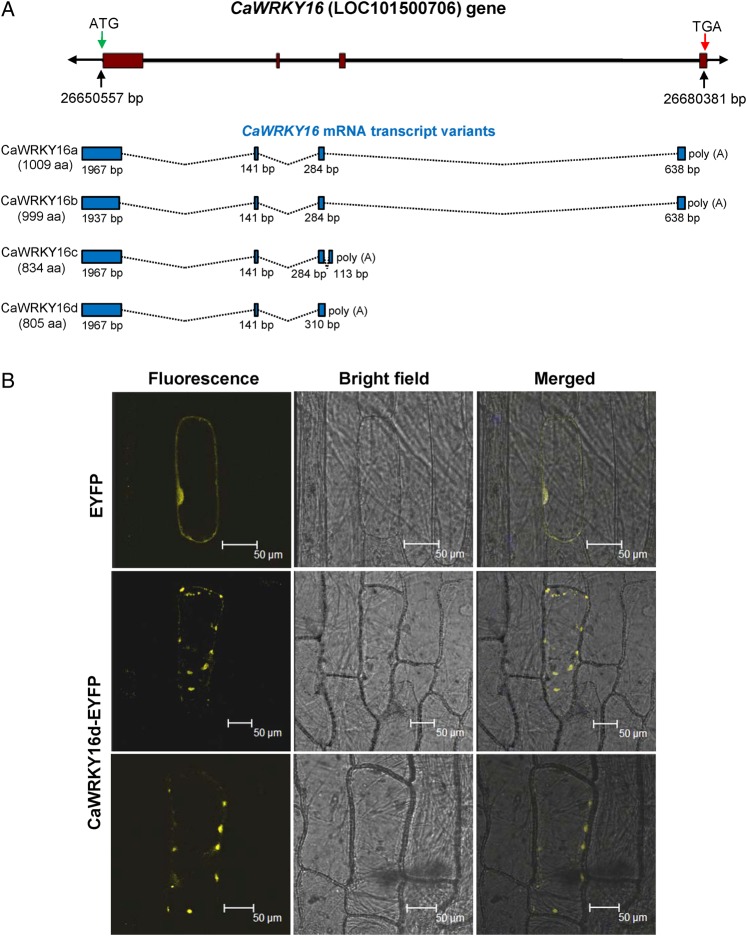
Figure 3.
CaWRKY16 gene structure, transcribed mRNA isoforms, and subcellular localization. (A) CaWRKY16 genomic structure and transcribed mRNA transcript isoforms. The black line indicates introns and the filled boxes are exons. In the gene structure, position of CaWRKY16 on Ca2 chromosome of ‘CDC Frontier’ is mentioned in base pairs. Size of the protein encoded by each transcript is shown in parentheses below name of isoforms. The 5′ and 3′ UTRs are excluded in the terminal exons of mRNA transcript structures. The size of each exon in a transcript is mentioned below the exon. The transcripts CaWRKY16c and CaWRKY16d are products of alternative cleavage and polyadenylation. (B) CaWRKY16d-EYFP fusion protein showed punctate fluorescence in onion cells. Bars = 50 µm. This figure is available in black and white in print and in colour at DNA Research online.

