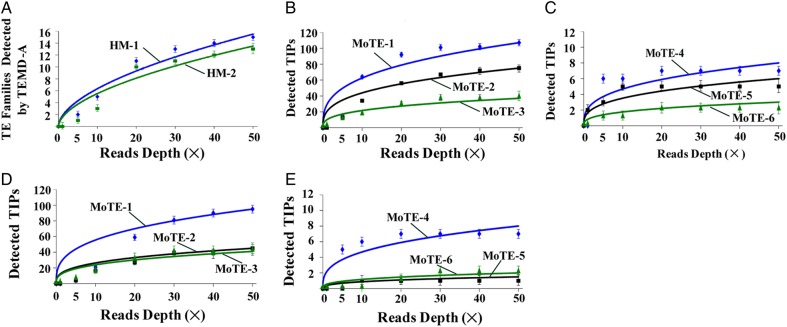
Figure 3.
The PTEMD performance on polymorphic TE scanning and TIPs detection under different depths of re-sequencing data sets in M. oryzae. Y-axis represents the number of the TE families detected with the vertical line indicates standard deviation (A) and represents the number of detected TIPs with the vertical line indicates standard deviation (B–E). (A) PTEMD-A-detected TE families (HM-1 and HM-2 are two strains). X-axis: reads coverage of M. oryzae genome. (B) PTEMD-B-detected TIPs in HM-1 strain for MoTE-1–3. (C) PTEMD-B-detected TIPs in HM-1 strain for MoTE-4 to 6. (D) PTEMD-B-detected TIPs in HM-2 strain for MoTE-1–3. (E) PTEMD-B-detected TIPs in HM-2 strain for MoTE-4–6. This figure is available in black and white in print and in colour at DNA Research online.

