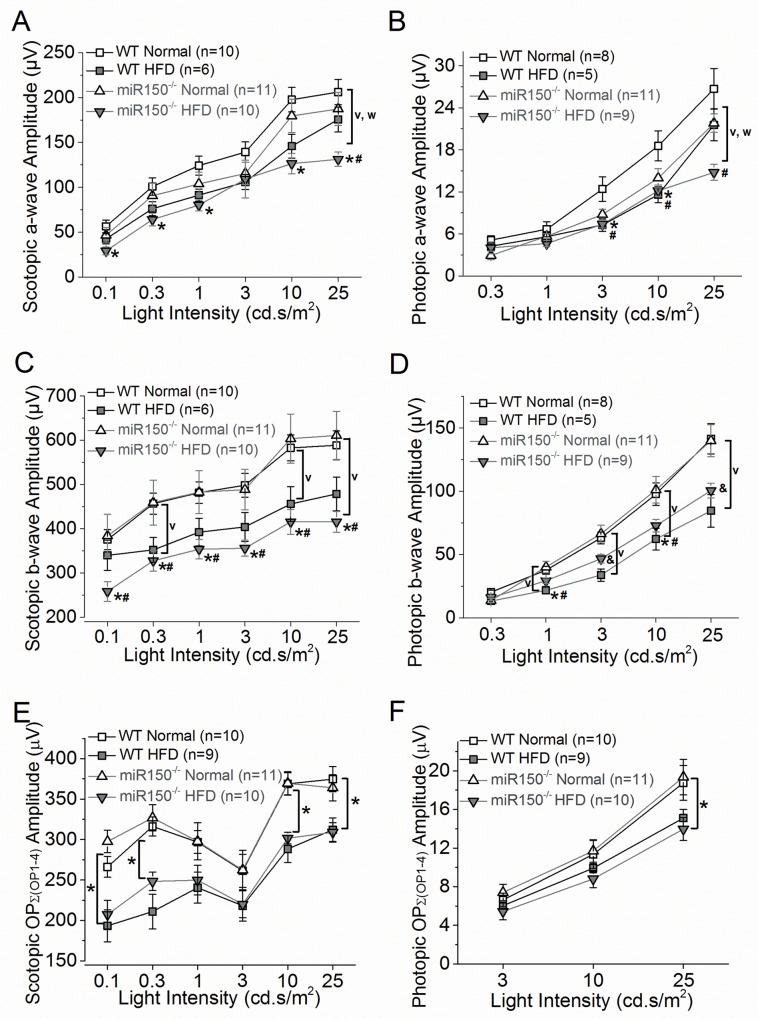
Fig 2. Scotopic and photopic light responses are decreased in WT and miR-150-/- mice fed with HFD.
All mice were dark adapted for at least 6 hours before ERG recordings. (A) The average scotopic ERG a-wave amplitudes recorded from miR-150-/- with HFD (miR-150-/--HFD) are significantly lower compared to the WT fed with normal chow diet (WT-Normal; *) or miR-150-/- fed with normal chow diet (miR-150-/--Normal; #). There is no statistical difference between WT fed with HFD (WT-HFD) and miR-150-/--HFD. HFD-mice (both WT and miR-150-/- groups) had significantly smaller (v) a-wave amplitudes compared to mice fed with a normal chow (both WT and miR-150-/- groups). The miR-150-/- mice (both normal chow and HFD groups) had significantly smaller (w) a-wave amplitudes compared to the WT mice (both normal chow and HFD groups). (B) The averaged photopic ERG a-wave amplitudes recorded from WT-HFD are significantly lower than WT-Normal (*) at 3 and 10 cd.s/m2 light intensities. The photopic a-wave amplitudes recorded from miR-150-/--HFD are significantly lower than WT-normal (#) at 3, 10, and 25 cd.s/m2 light intensities. HFD-mice (both WT and miR-150-/- groups) had significantly smaller (v) amplitudes compared to mice fed with a normal chow (both WT and miR-150-/- groups). (C) The average scotopic ERG b-wave amplitudes recorded from miR-150-/--HFD are significantly lower compared to WT-Normal (*) or miR-150-/--Normal (#). There is no statistical difference between WT-HFD and miR-150-/--HFD. HFD-mice (both WT and miR-150-/- groups) had significantly smaller (v) a-wave amplitudes compared to mice fed with a normal chow (both WT and miR-150-/- groups). The miR-150-/- mice (both normal chow and HFD groups) had significantly smaller (w) a-wave amplitudes compared to the WT mice (both normal chow and HFD groups). (D) The averaged ERG photopic b-wave amplitudes recorded from WT-HFD are significantly lower than WT-Normal (*) and miR-150-/--Normal (#) at 1 and 10 cd.s/m2 light intensities. The photopic b-wave amplitudes recorded from miR-150-/--HFD are significantly different from the other 3 groups (&) at 25 cd.s/m2 light intensities. HFD-mice (both WT and miR-150-/- groups) had significantly smaller (v) amplitudes compared to mice fed with a normal chow (both WT and miR-150-/- groups). (E) The averaged scotopic oscillatory potential amplitudes [as a summation from OP1 to OP4; Ʃ(OP1-4)] recorded from HFD-mice (both WT-HFD and miR-150-/--HFD) are significantly lower (*) than mice fed with a normal chow (both WT-Normal and miR-150-/--Normal) at 0.1, 0.3, 10, and 25 cd.s/m2 light intensities. (F) The averaged photopic oscillatory potential amplitudes [Ʃ(OP1-4)] recorded from HFD-mice (both WT-HFD and miR-150-/--HFD) are significantly lower (*) than mice fed with a normal chow (both WT-Normal and miR-150-/--Normal) at 25 cd.s/m2 light intensities. (A-F) Overall, there is no statistical significance of interaction between two factors: miR-150 null mutation and HFD regimen (2-way ANOVA). p < 0.05 (denoted as *, #, &, v, w). Data of scotopic and photopic ERG a- and b-waves and OPs are listed in Tables 1 and 2.

