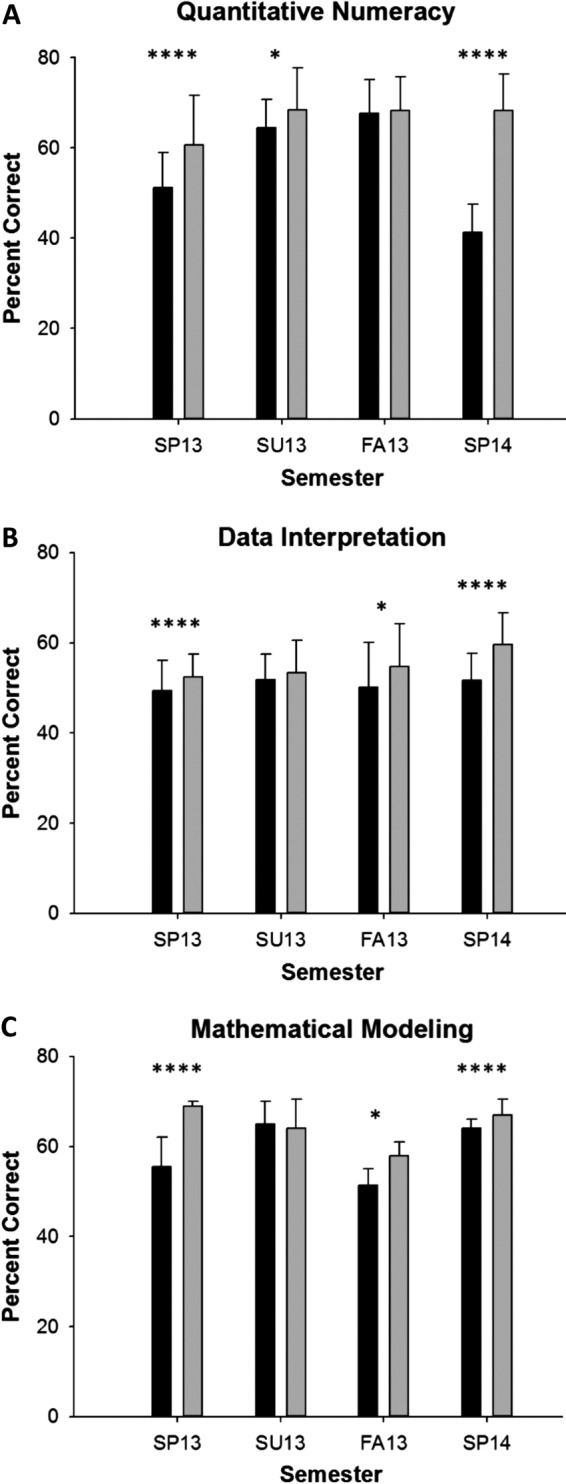
Figure 1.

Results of pre/posttest for (A) quantitative numeracy, (B) data interpretation, and (C) mathematical modeling. Data reflect the average percent of students (±1 SE) who provided the correct answer on the pre- and posttest on questions that addressed each skill. Significant differences from the nested logistic regression between the pre- and posttest scores are indicated above the bars for each semester: ****, p < 0.0001; *, p < 0.05.
